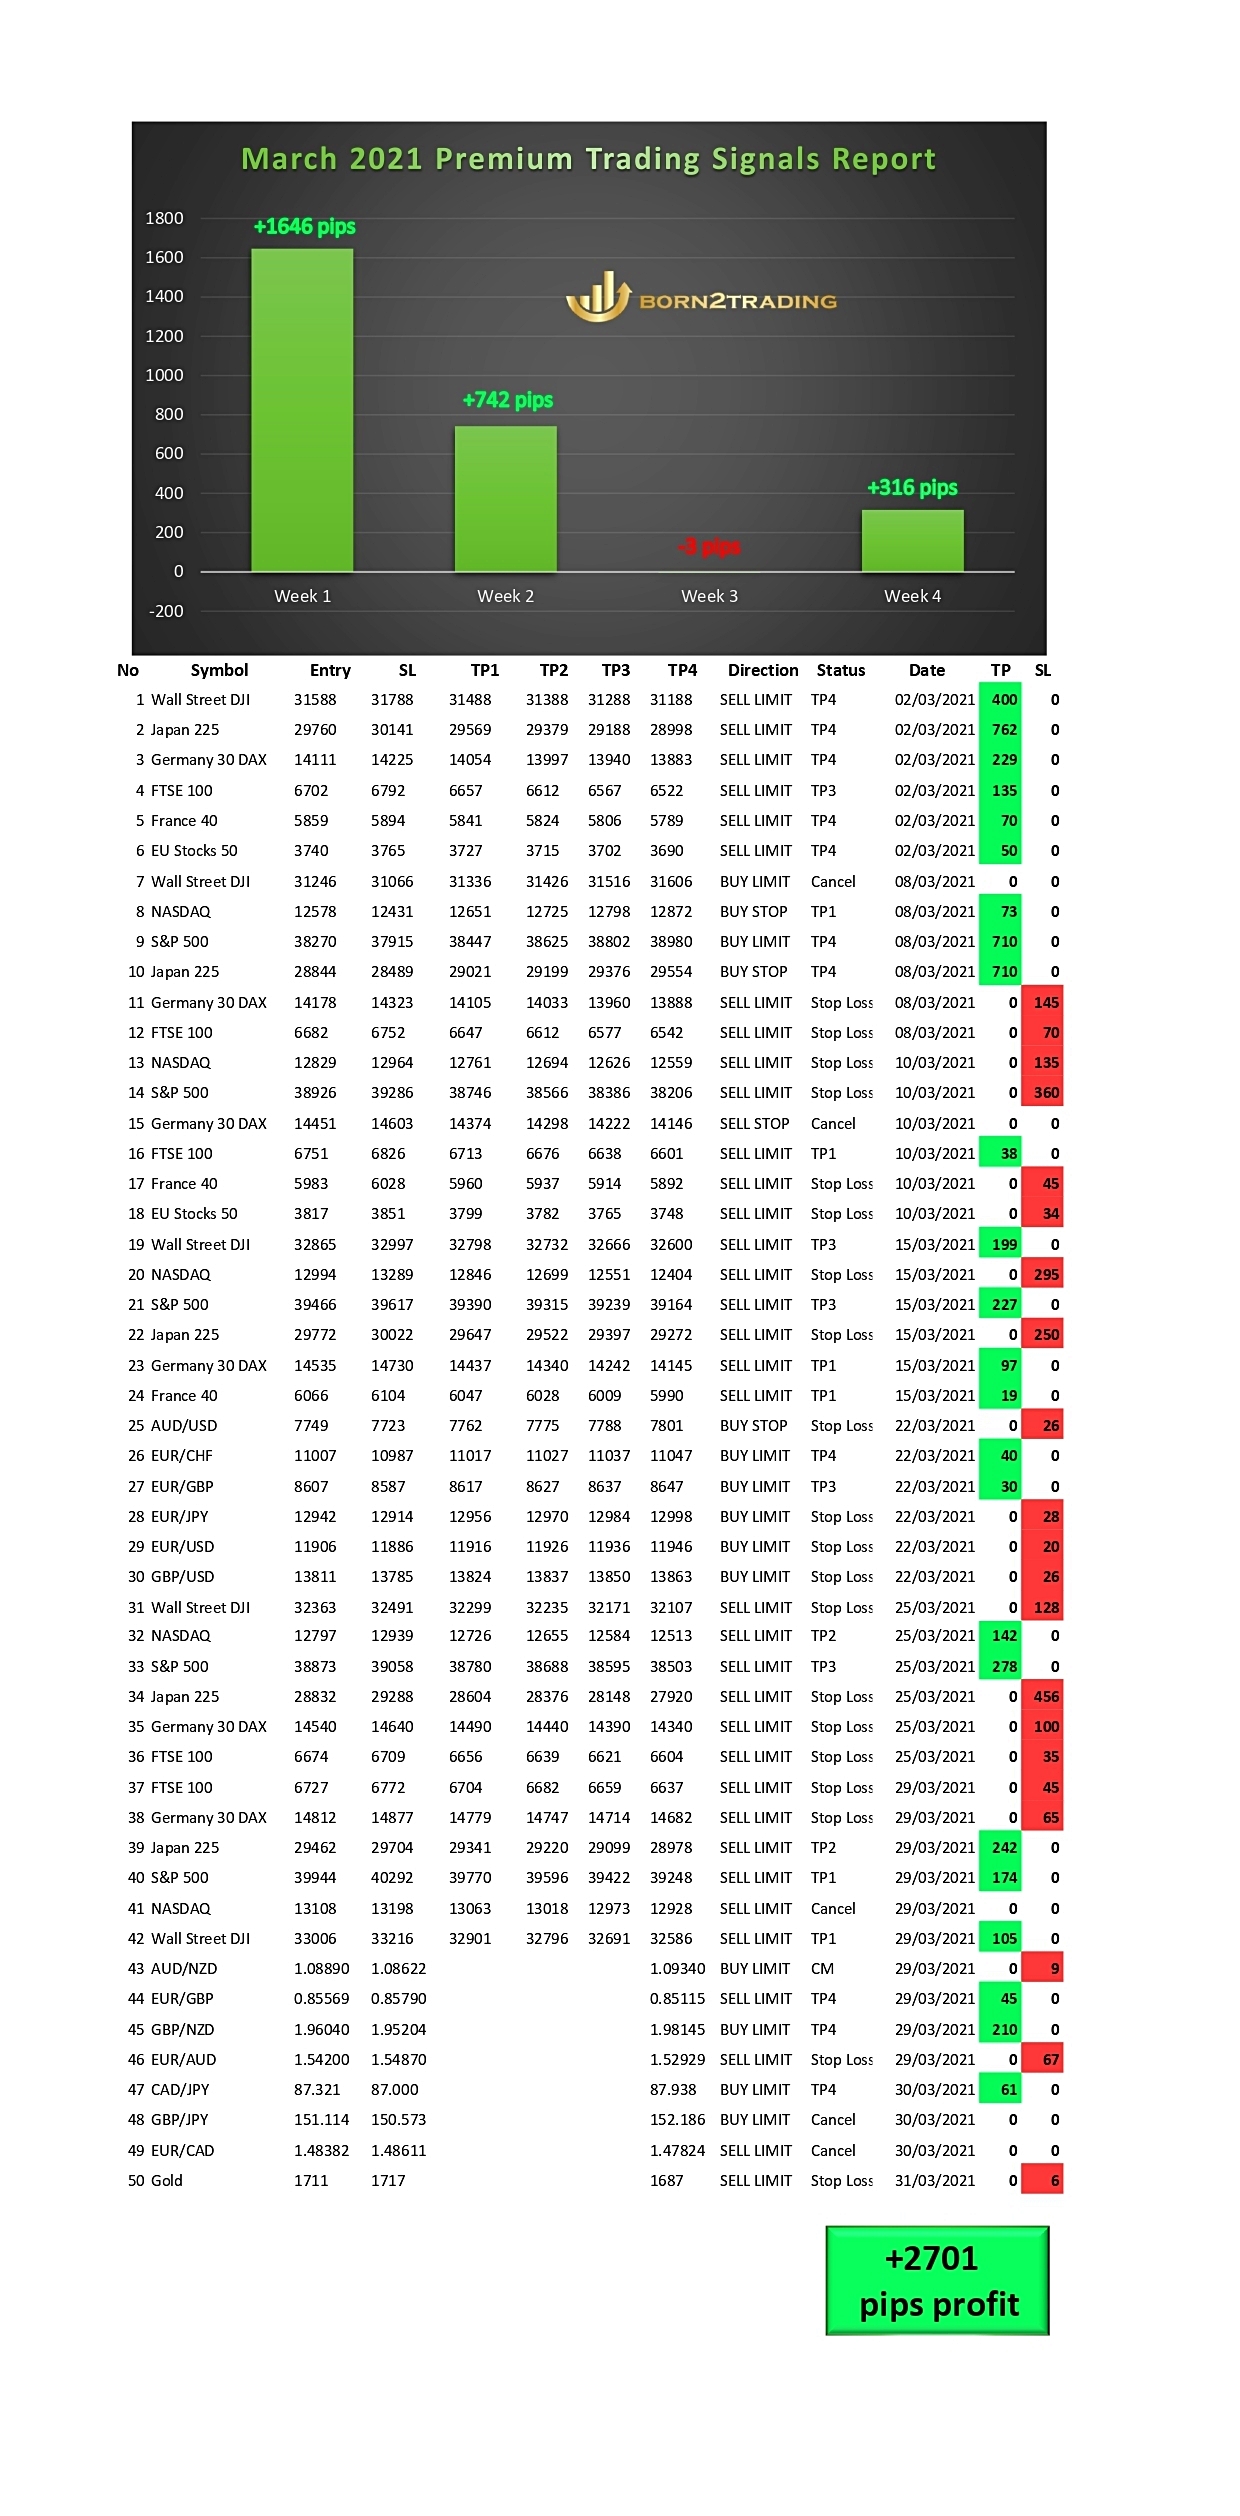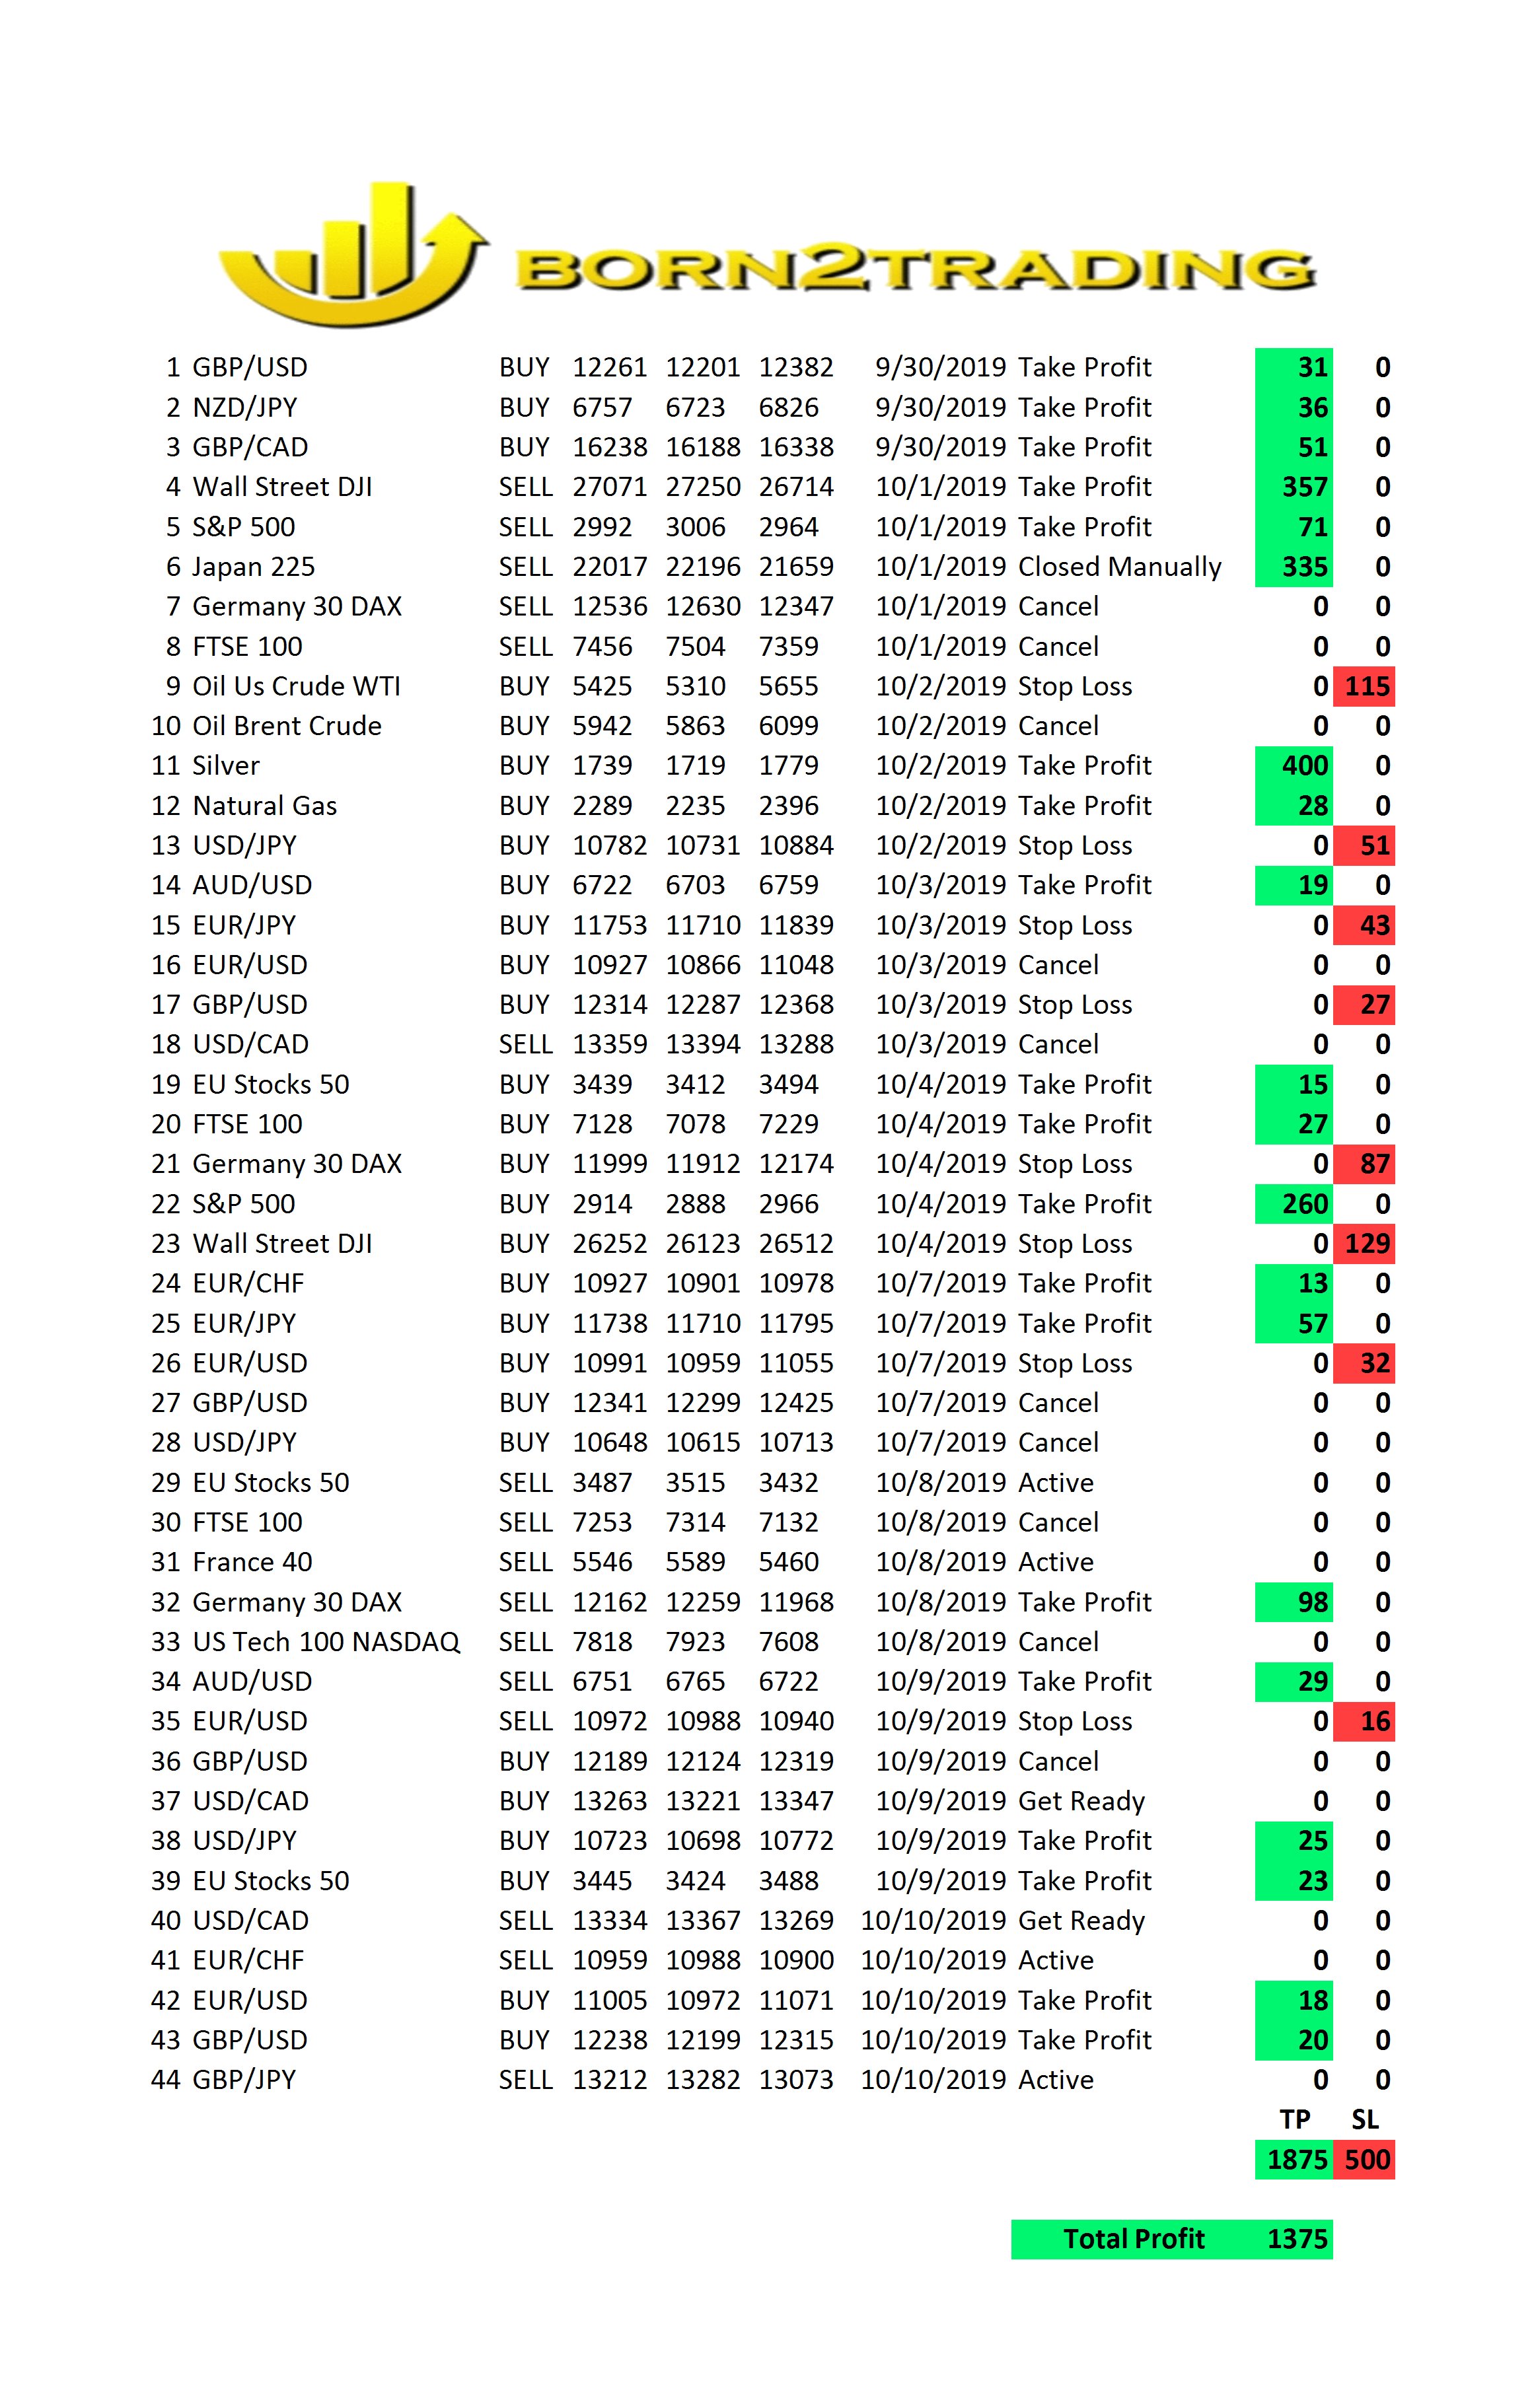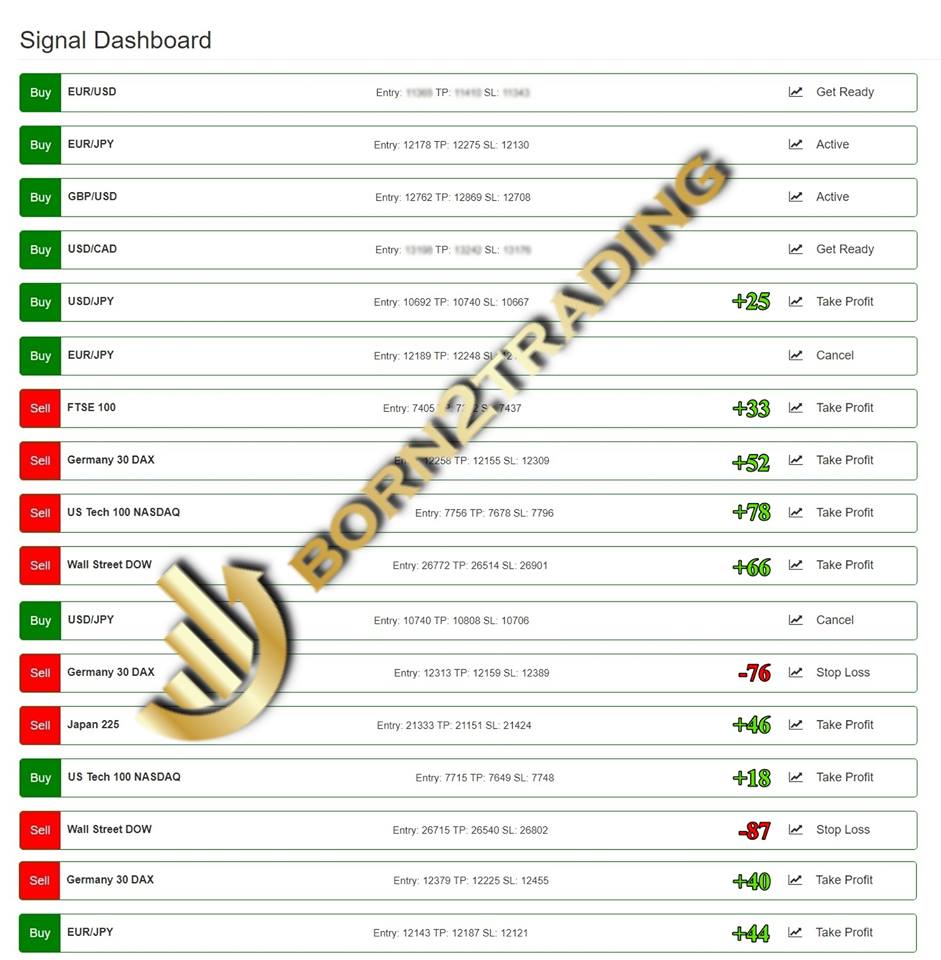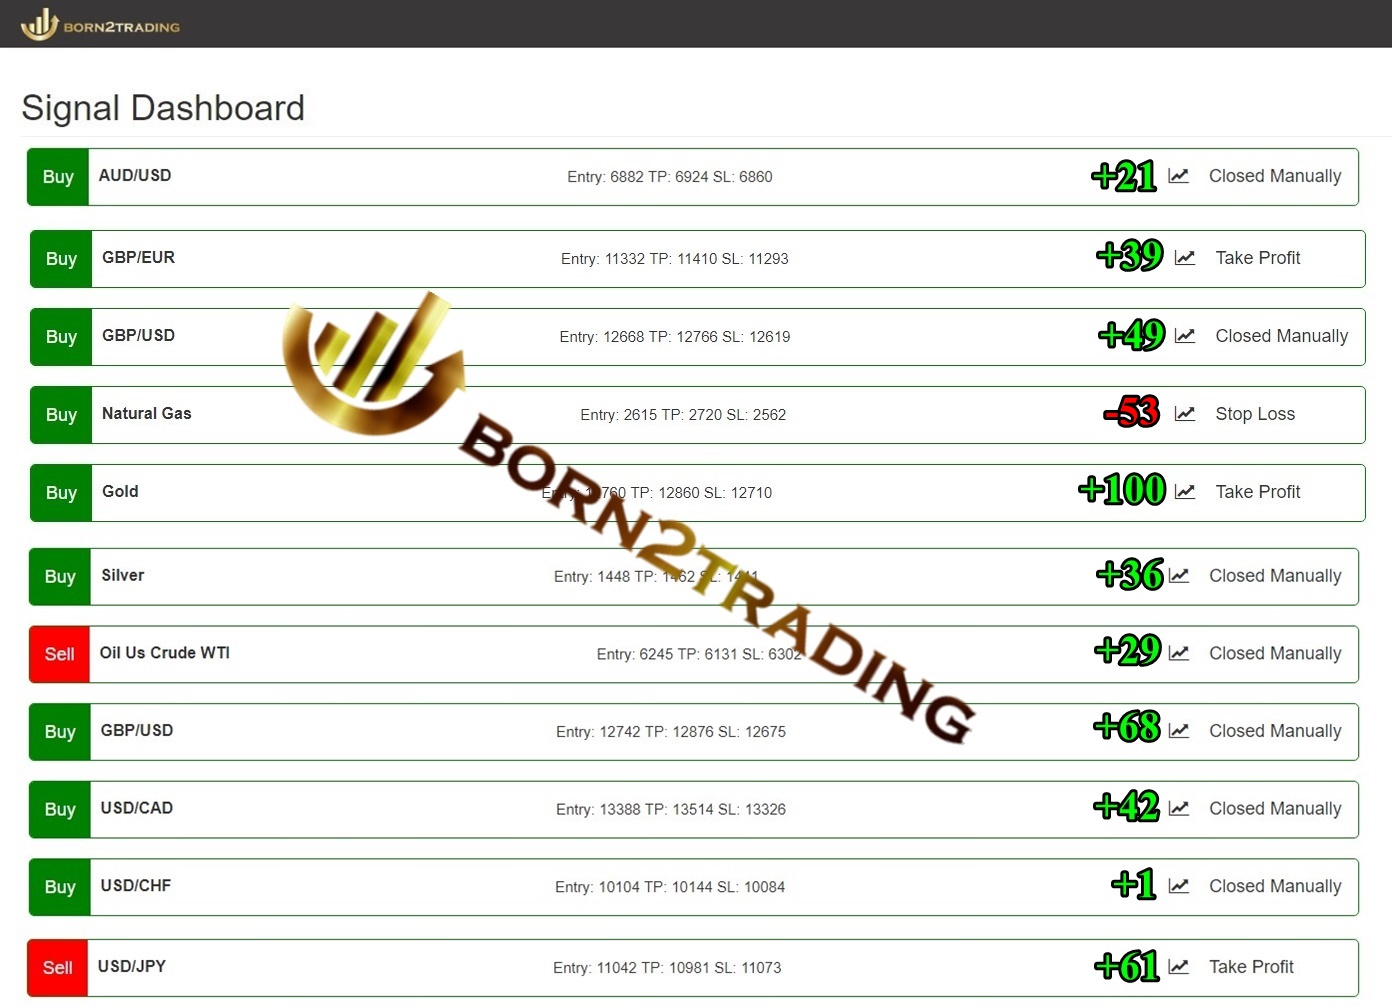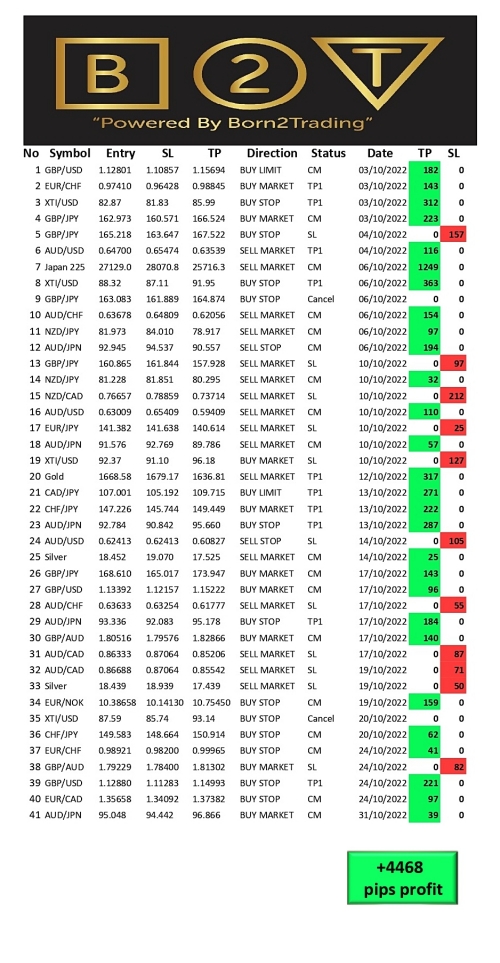
October 2022 - Premium Trading Signals Report
Hi Traders.
Time for our monthly trading signals report.
41 generated signals
2 not executed
11 closed with stop loss
28 closed with profit
71% accuracy
We thank all our clients for their trust and cooperation so far.
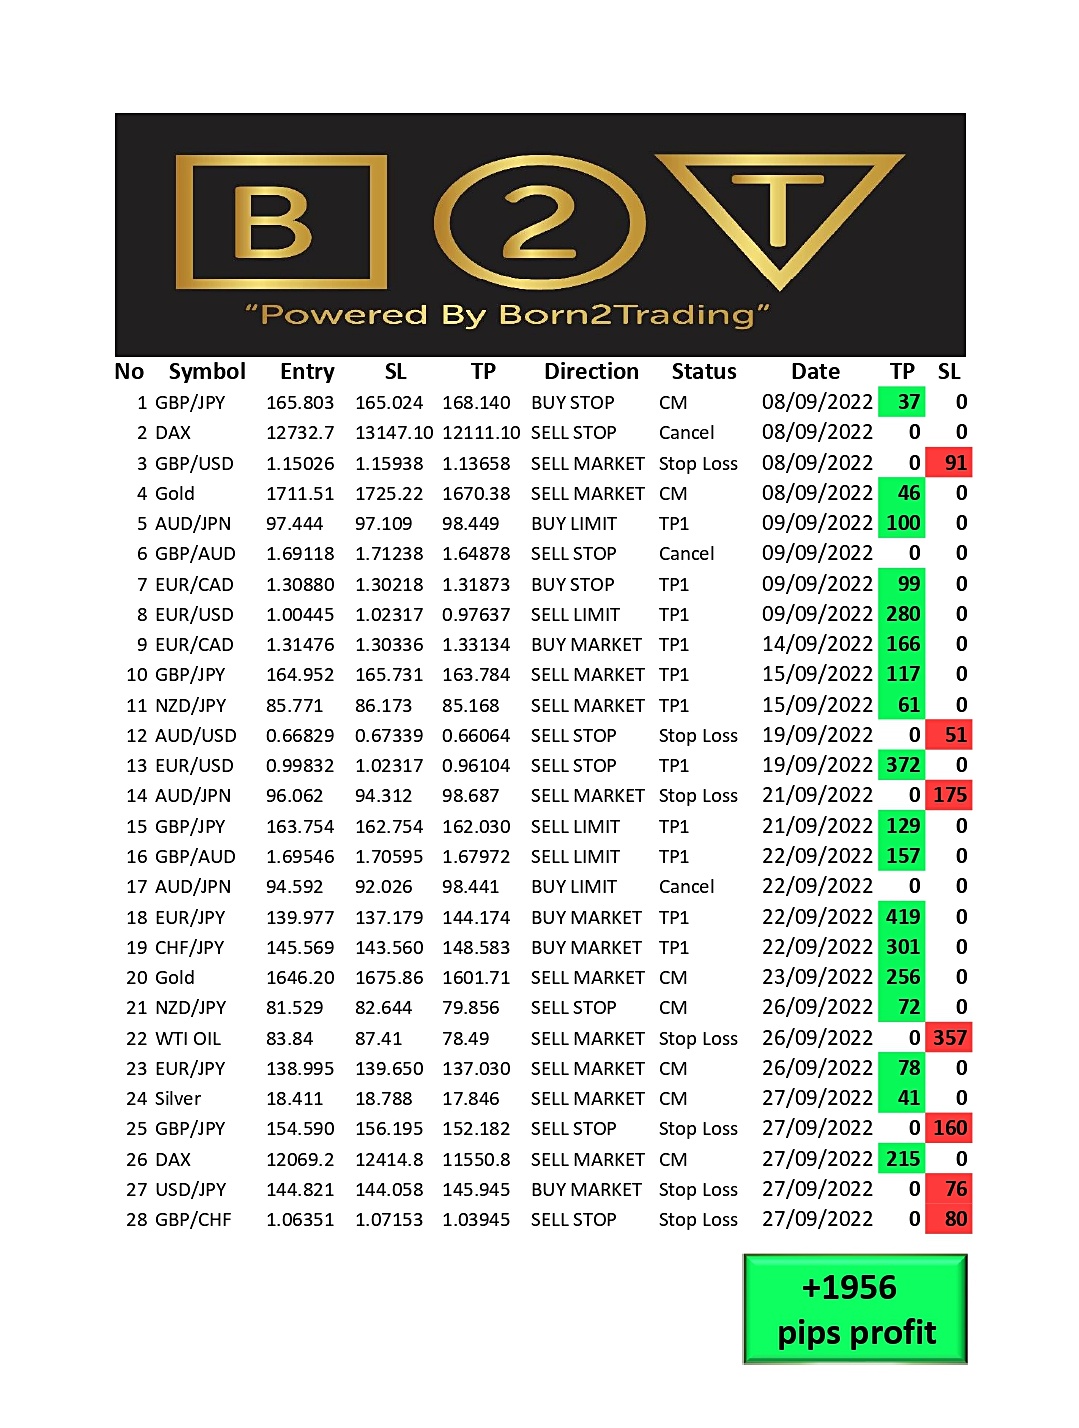
September 2022 - Premium Trading Signals Report
Hi Traders.
Time for our monthly trading signals report.
28 generated signals
3 not executed
7 closed with stop loss
18 closed with profit
72% accuracy
We thank all our clients for their trust and cooperation so far.
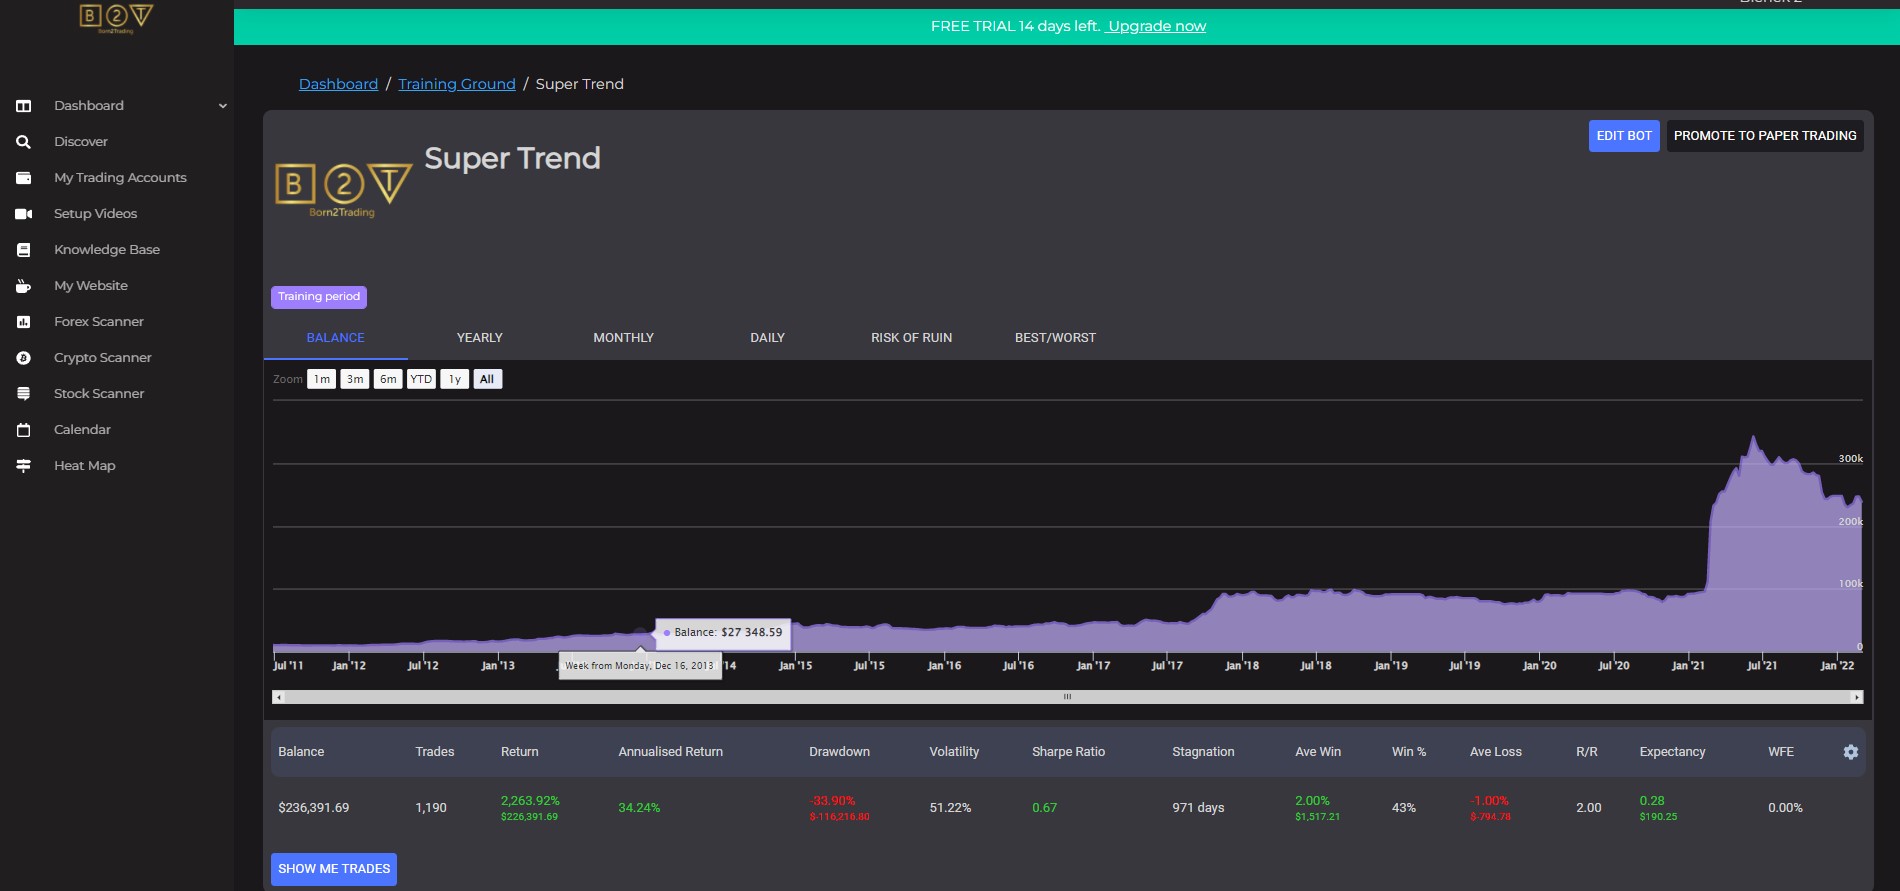
New Ai Trading portal is live
Our new AI ( bots ) trading portal is ready.
Enjoy your free trial.
You can tune the bots as you wish, or simple clone our best bots and copy trade from there.
You can also use Signal only , to get access to all signals generated by Bots and execute manually or automatically in your MT4/MT5.
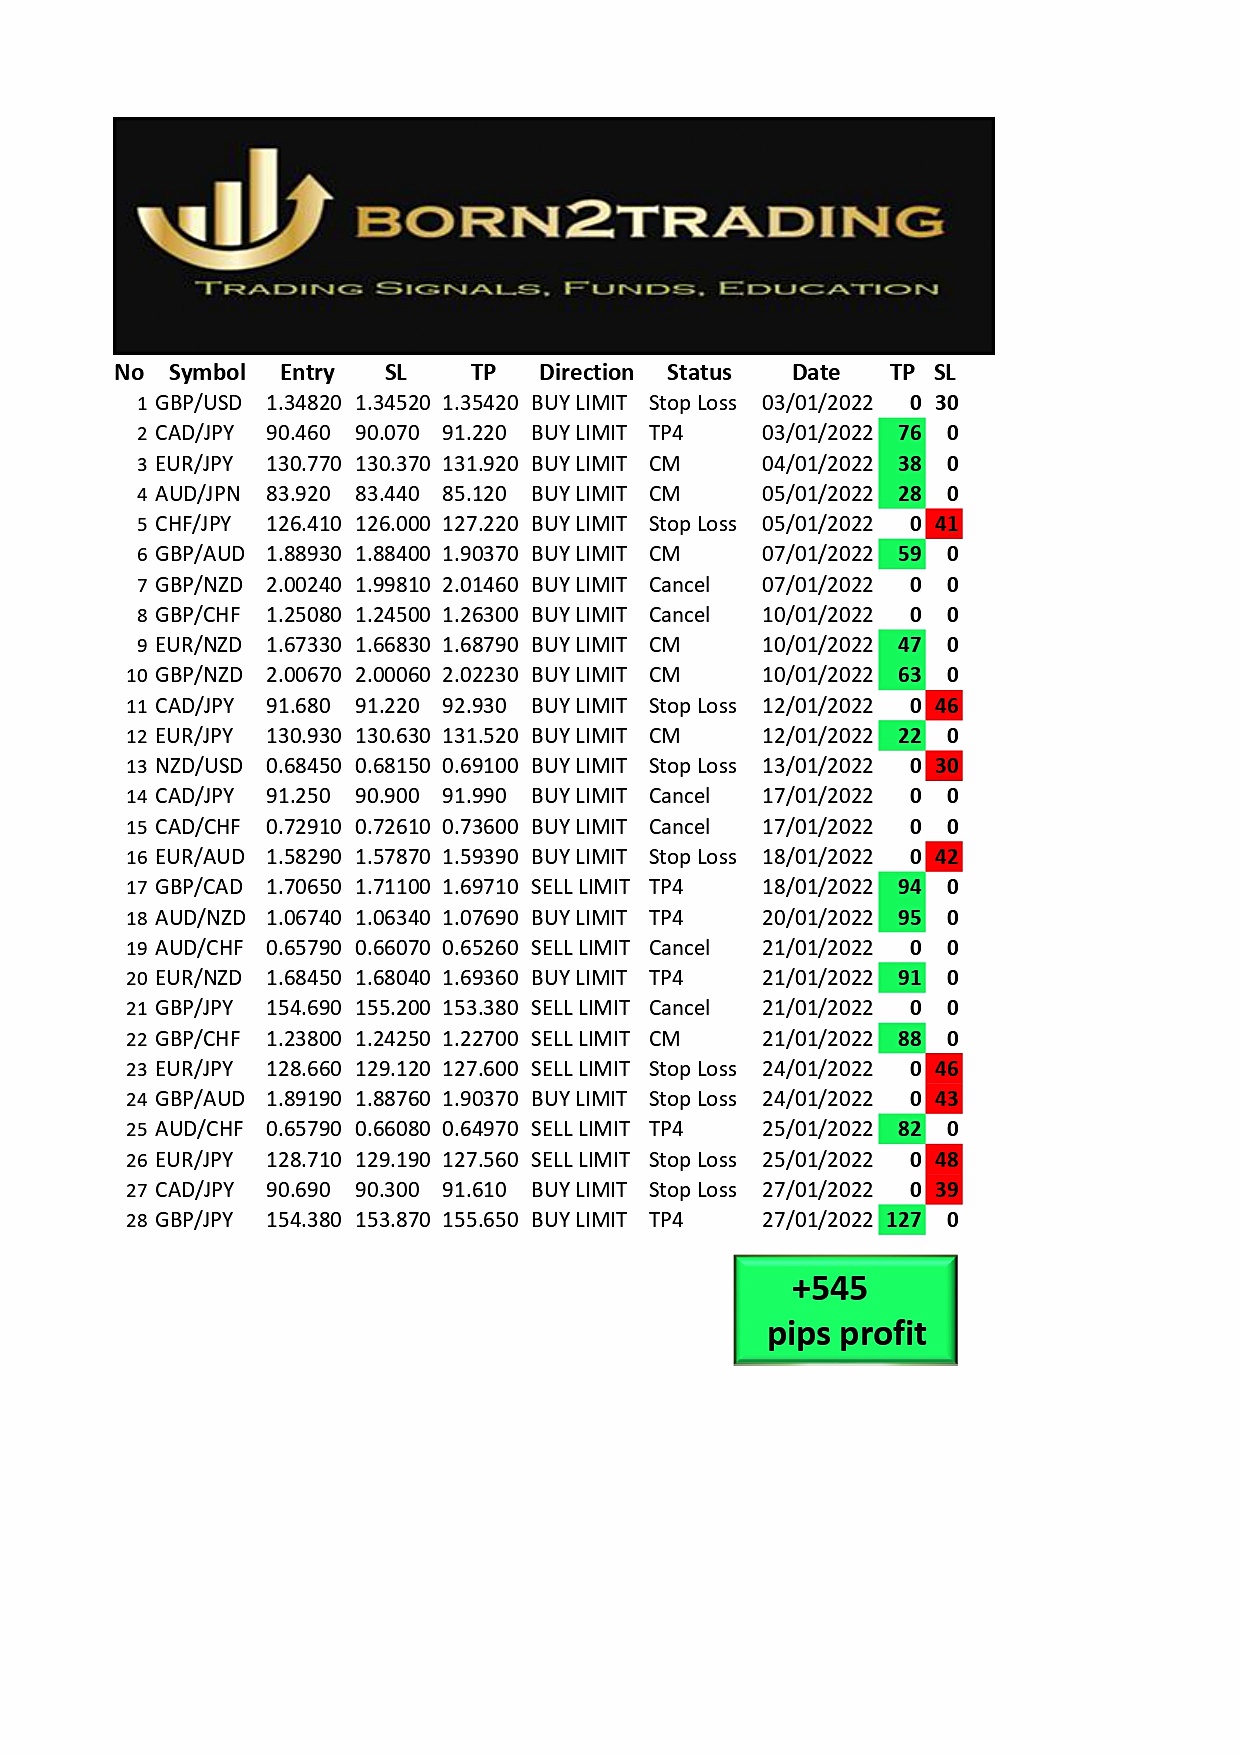
January 2022 - Premium Trading Signals Report
Hi Traders.
Time for our monthly trading signals report.
28 generated signals
6 not executed
9 closed with stop loss
13 closed with profit
60% accuracy
We thanks all our clients for their trust and cooperation so far.
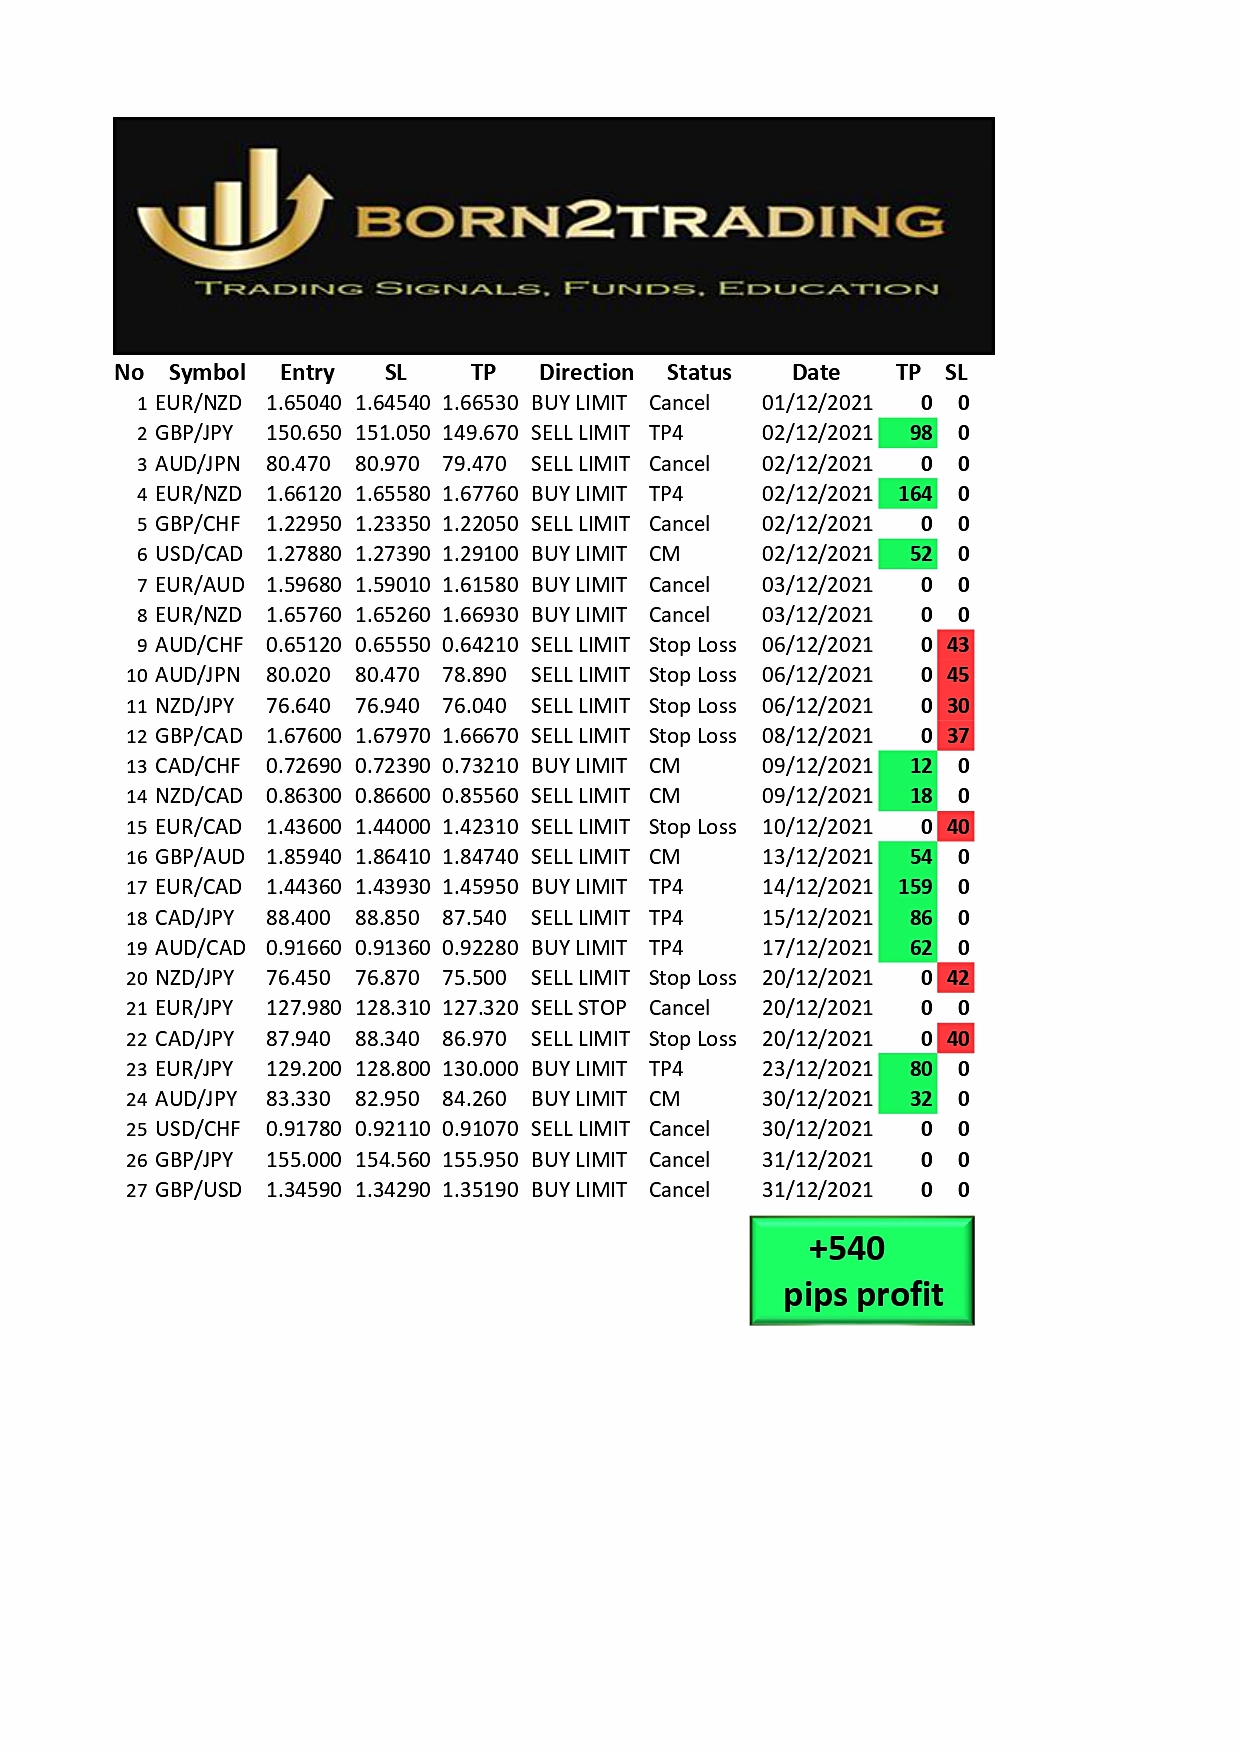
December 2021 - Premium Trading Signals Report
Hi Traders.
Time for our monthly trading signals report.
27 generated signals
9 not executed
7 closed with stop loss
11 closed with profit
61% accuracy
We thanks all our clients for their trust and cooperation so far.
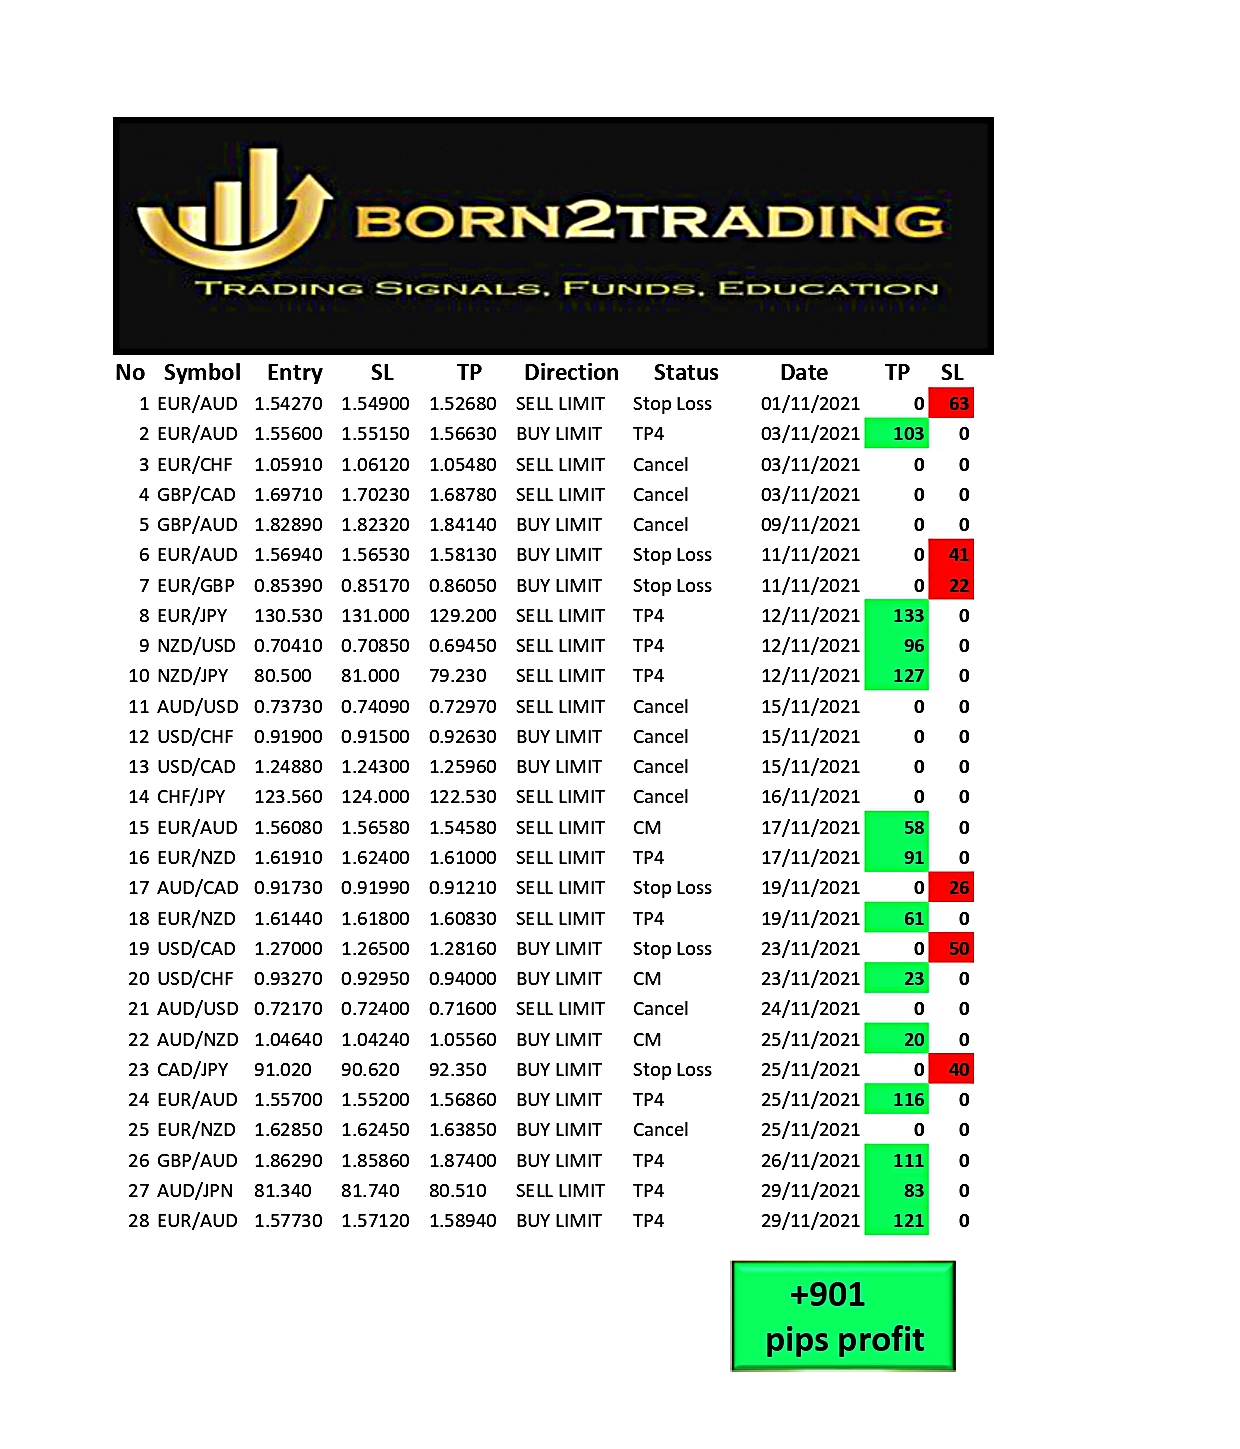
November 2021 - Premium Trading Signals Report
Hi Traders.
Time for our monthly trading signals report.
28 generated signals
9 not executed
6 closed with stop loss
13 closed with profit
68% accuracy
We thanks all our clients for their trust and cooperation so far.
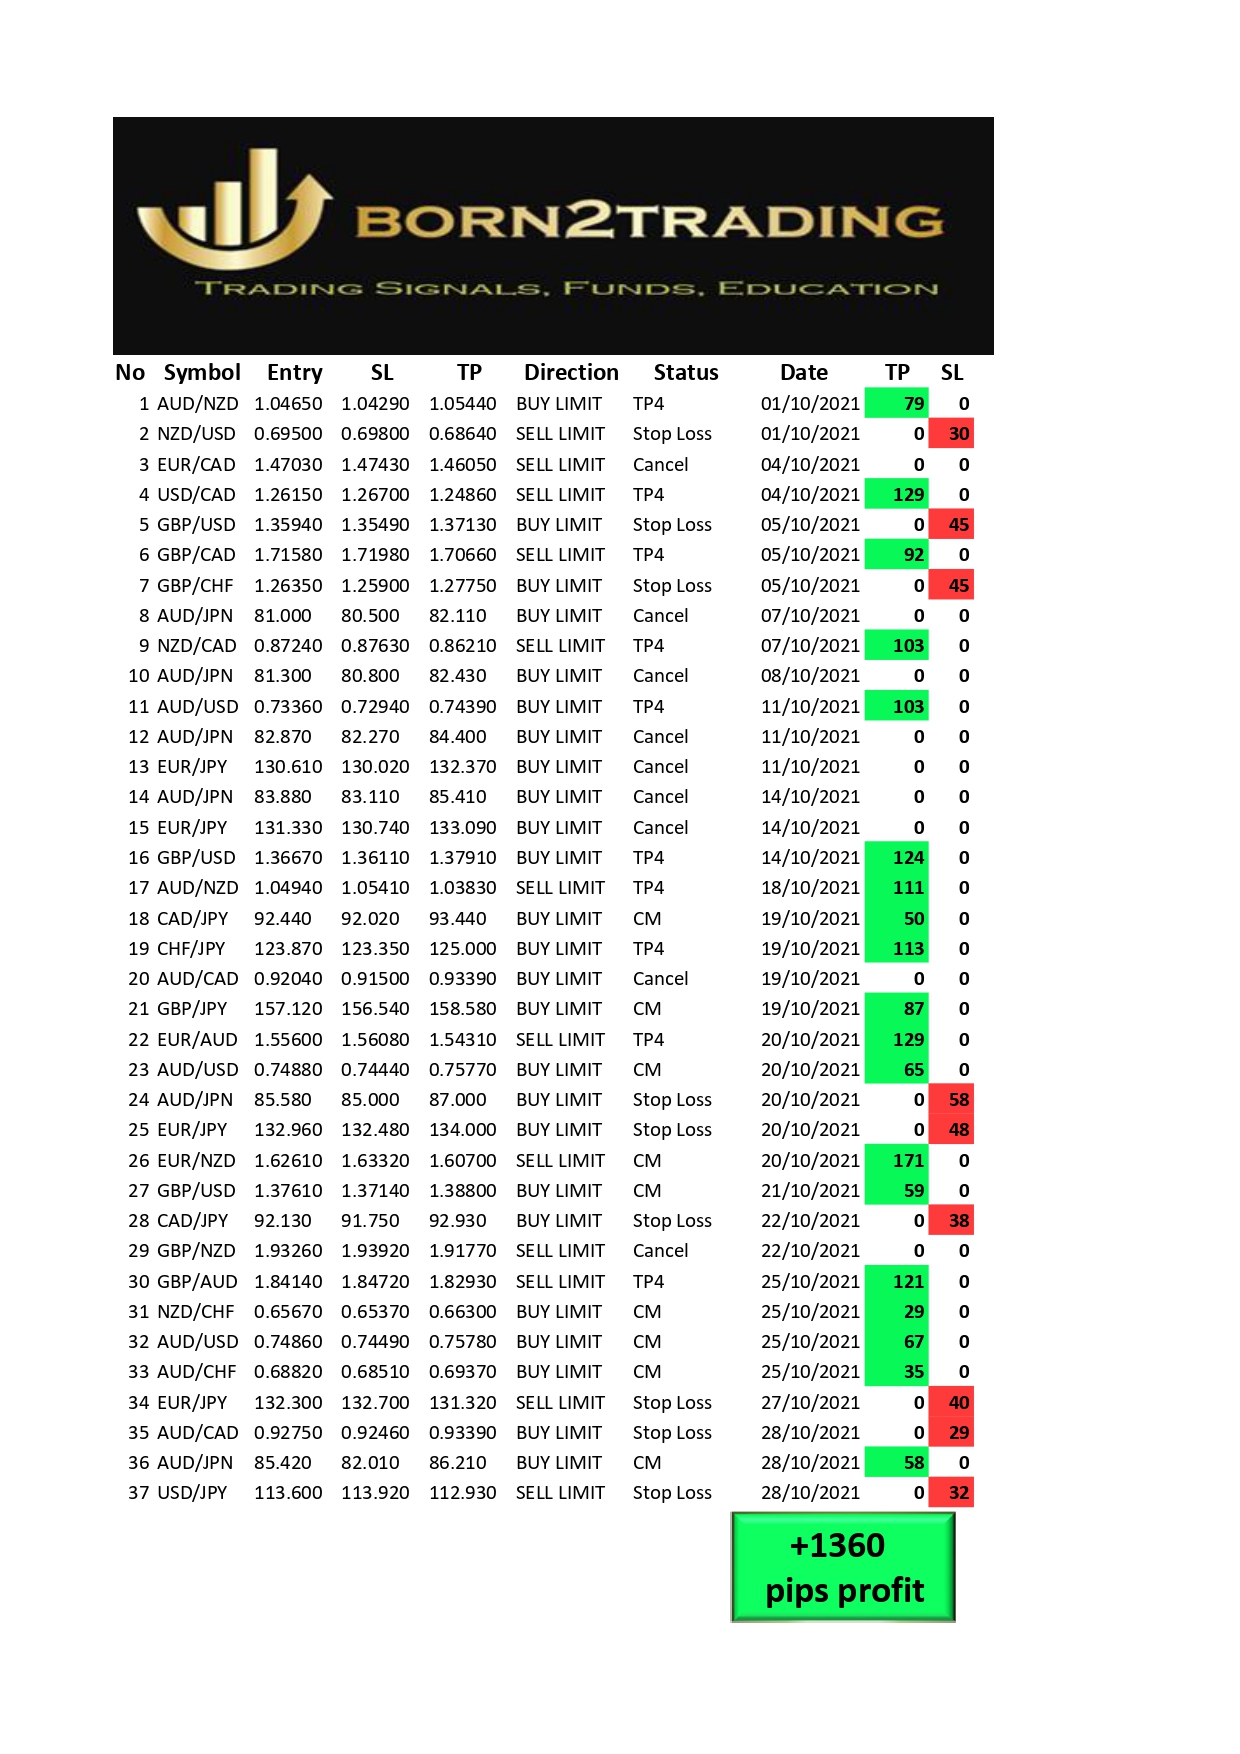
October 2021 - Premium Trading Signals Report
Hi Traders.
Time for our monthly trading signals report.
37 generated signals
9 not executed
9 closed with stop loss
19 closed with profit
67% accuracy
We thanks all our clients for their trust and cooperation so far.

September 2021 - Premium Trading signals report
Hi Traders.
Time for our monthly trading signals report.
45 generated signals
13 not executed
9 closed with stop loss
23 closed with profit
72% accuracy
We thanks all our clients for their trust and cooperation so far.
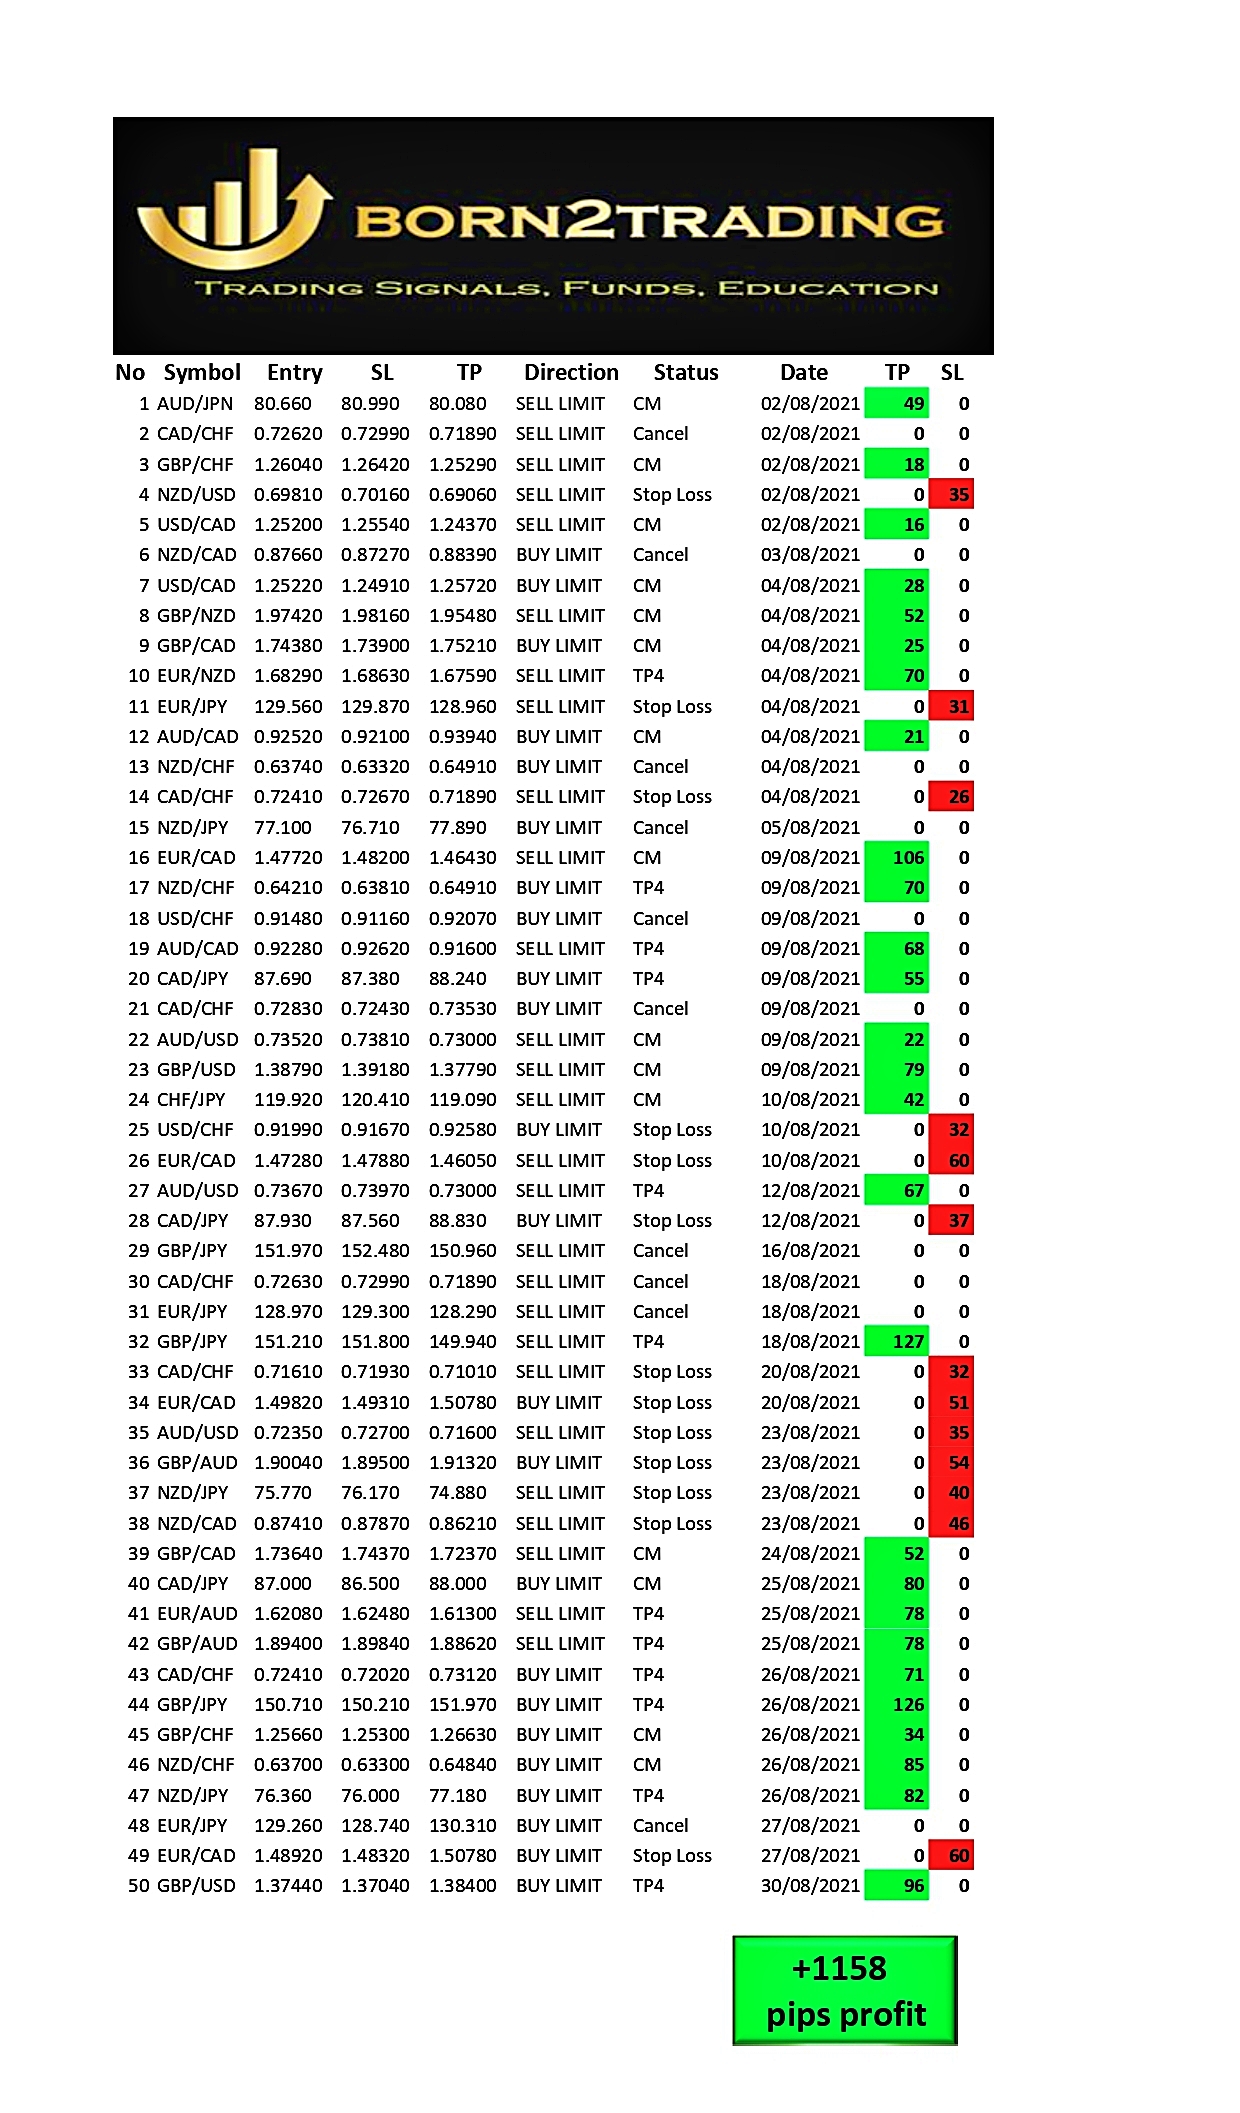
August 2021 - Trading Signals Report
Hi Traders.
Time for our monthly trading signals report.
50 generated signals
10 not executed
13 closed with stop loss
27 closed with profit
68% accuracy
We thanks all our clients for their trust and cooperation so far.

Discipline in Trading
Discipline may not be everything you need, but it is the one thing you need to make all of the other components in your craft work.
Without it, your actions are unreliable, and so too is every bit of knowledge and skill you possess.
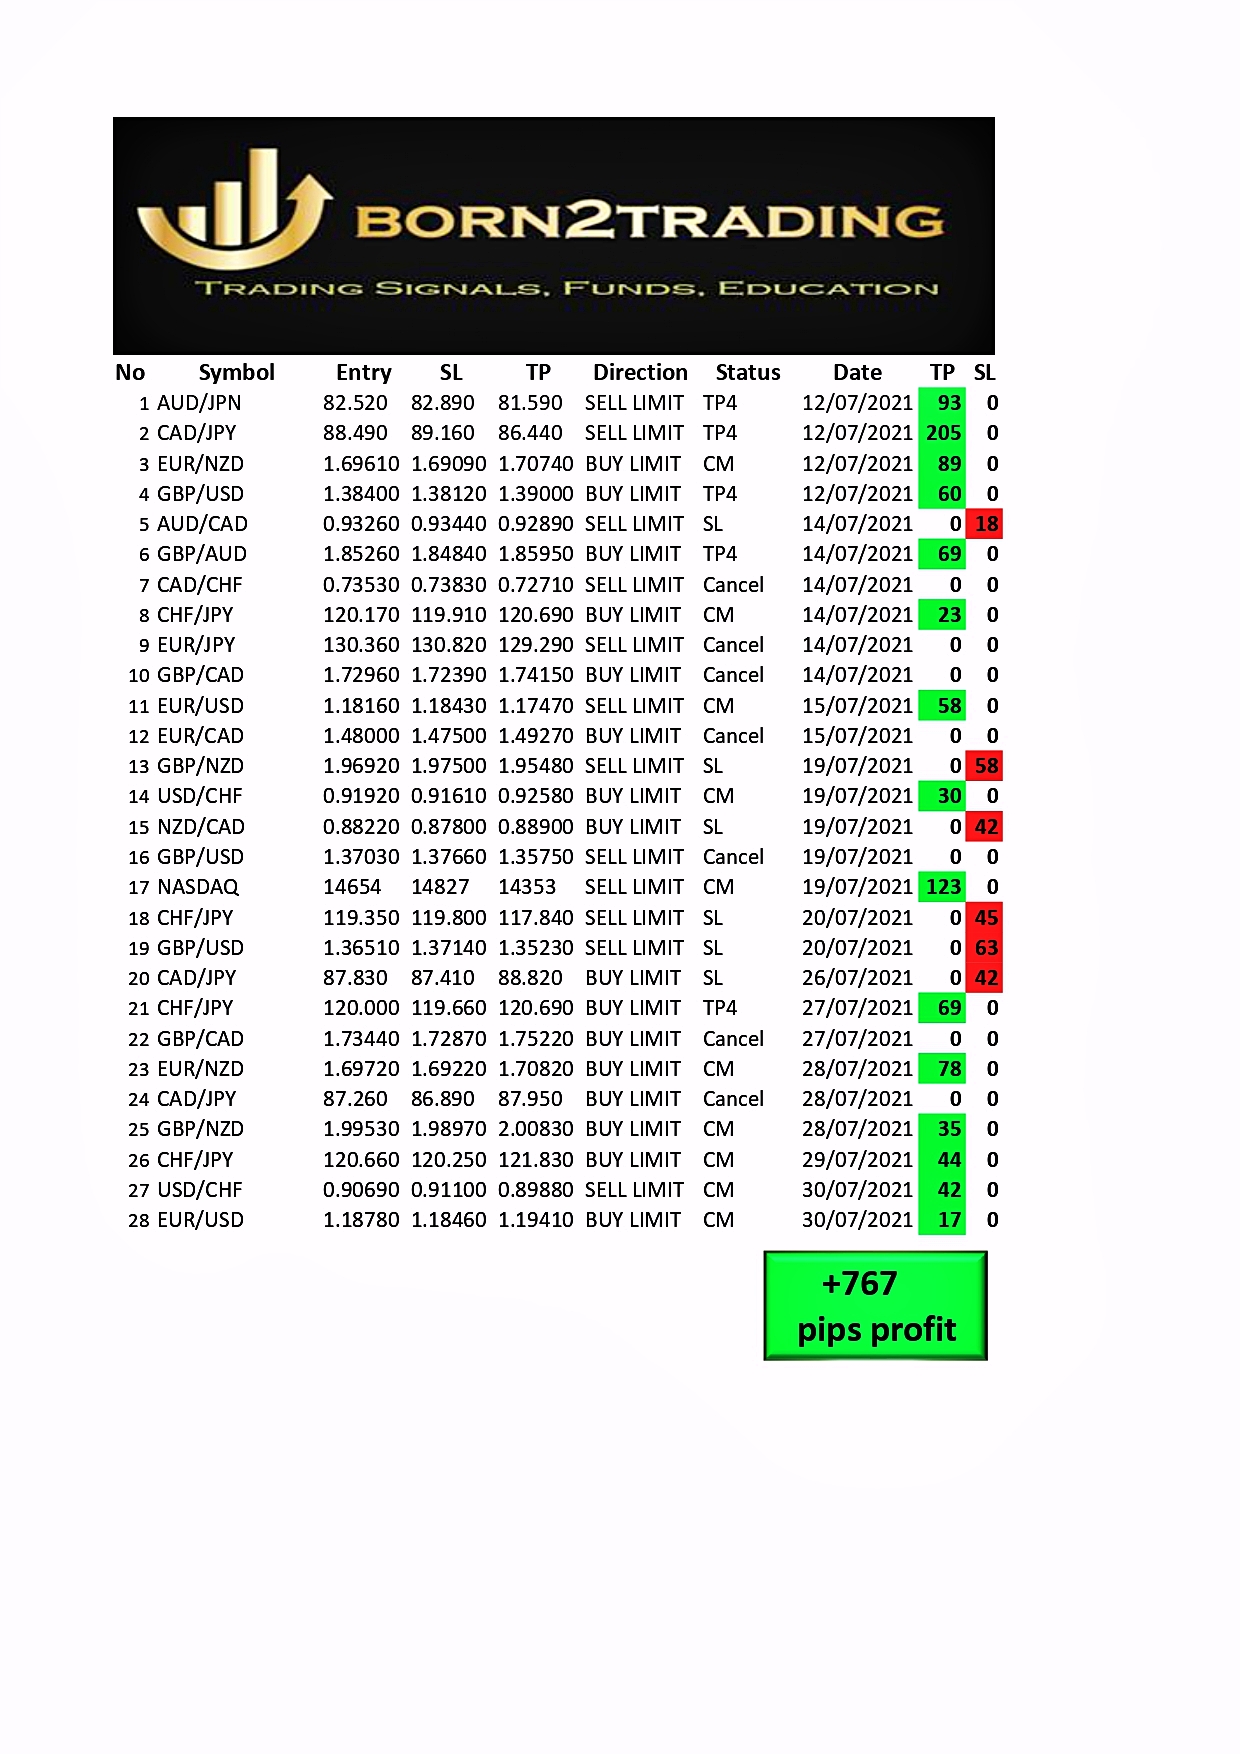
July 2021 - Premium Trading signals report
Hi Traders.
Time for our monthly trading signals report.
28 generated signals
7 not executed
6 closed with stop loss
15 closed with profit
71% accuracy
We thanks all our clients for their trust and cooperation so far.
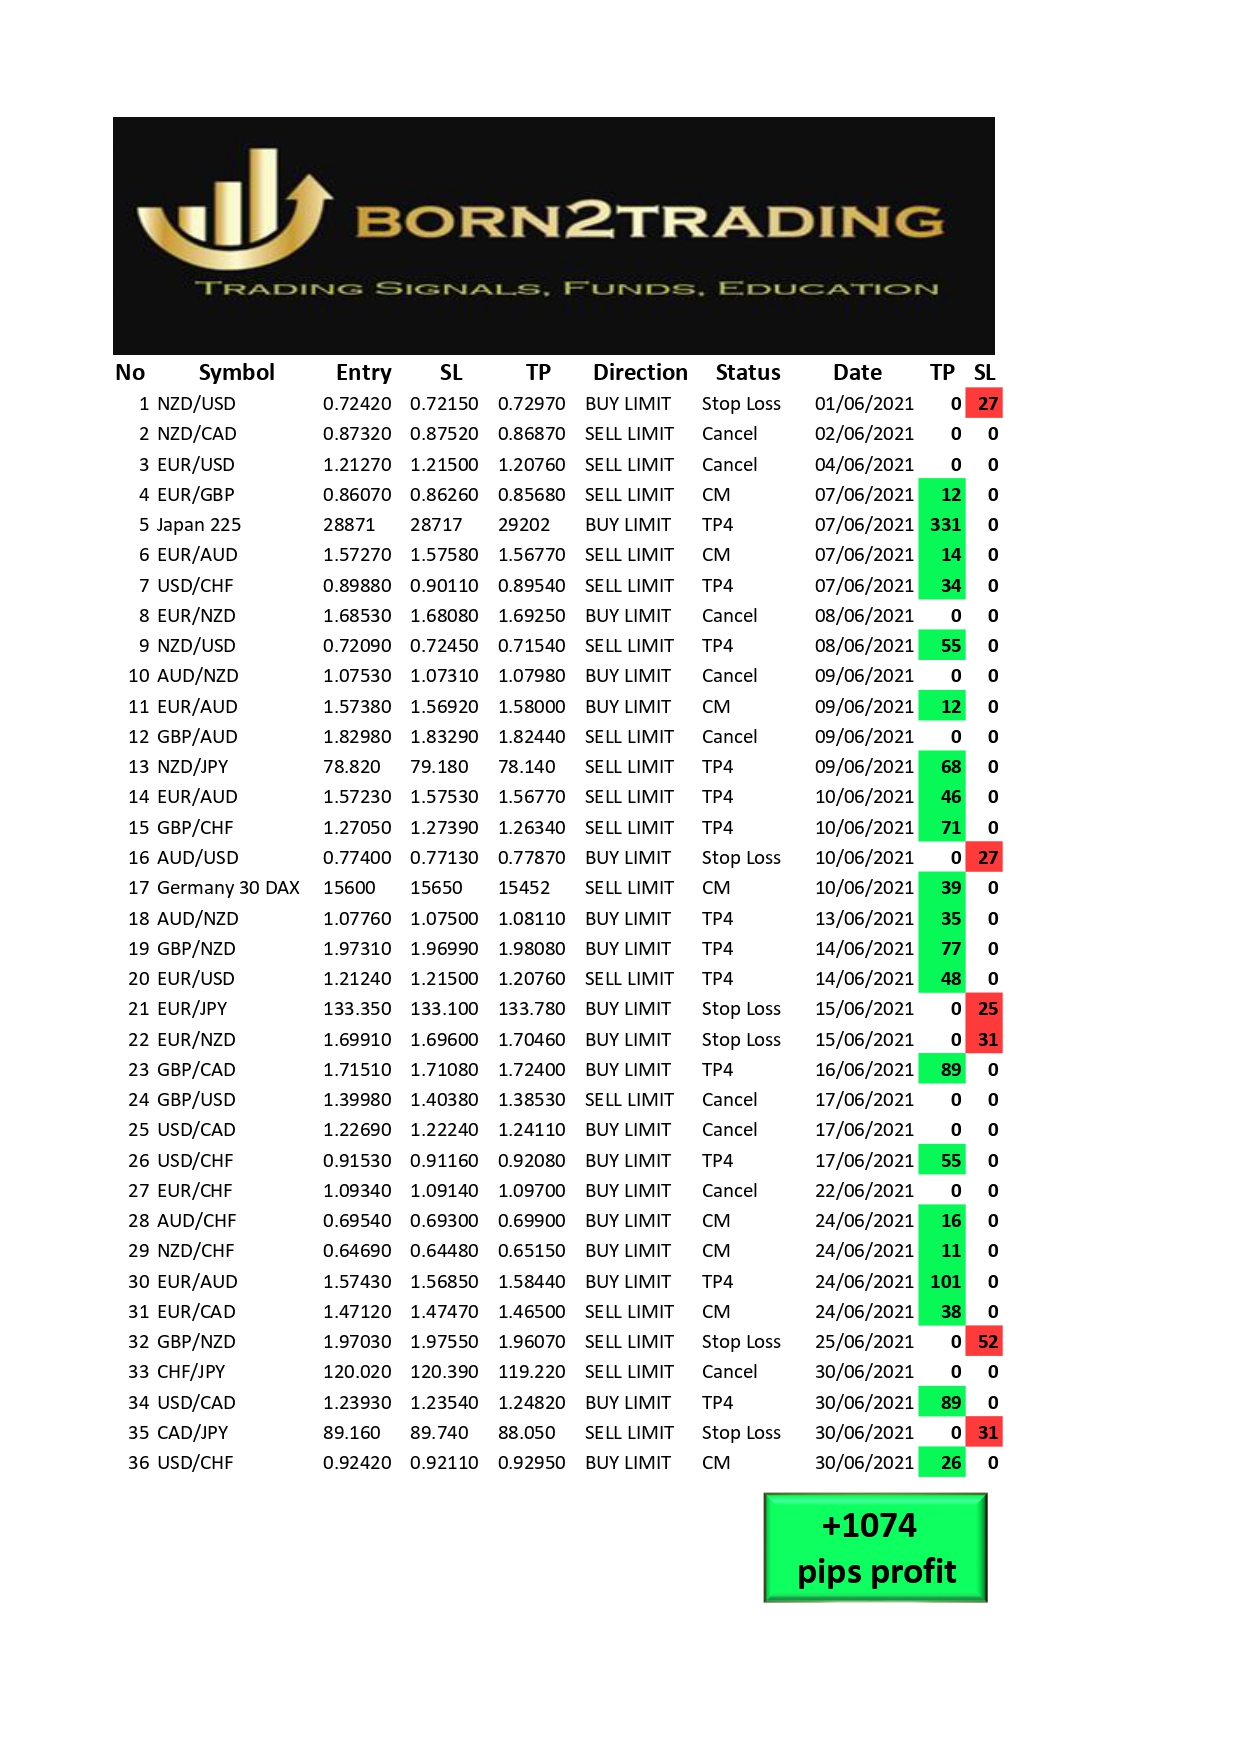
June 2021 - Premium Trading signals report
Hi Traders.
Time for our monthly trading signals report.
36 generated signals
9 not executed
6 closed with stop loss
21 closed with profit
77% accuracy
We thanks all our clients for their trust and cooperation so far.
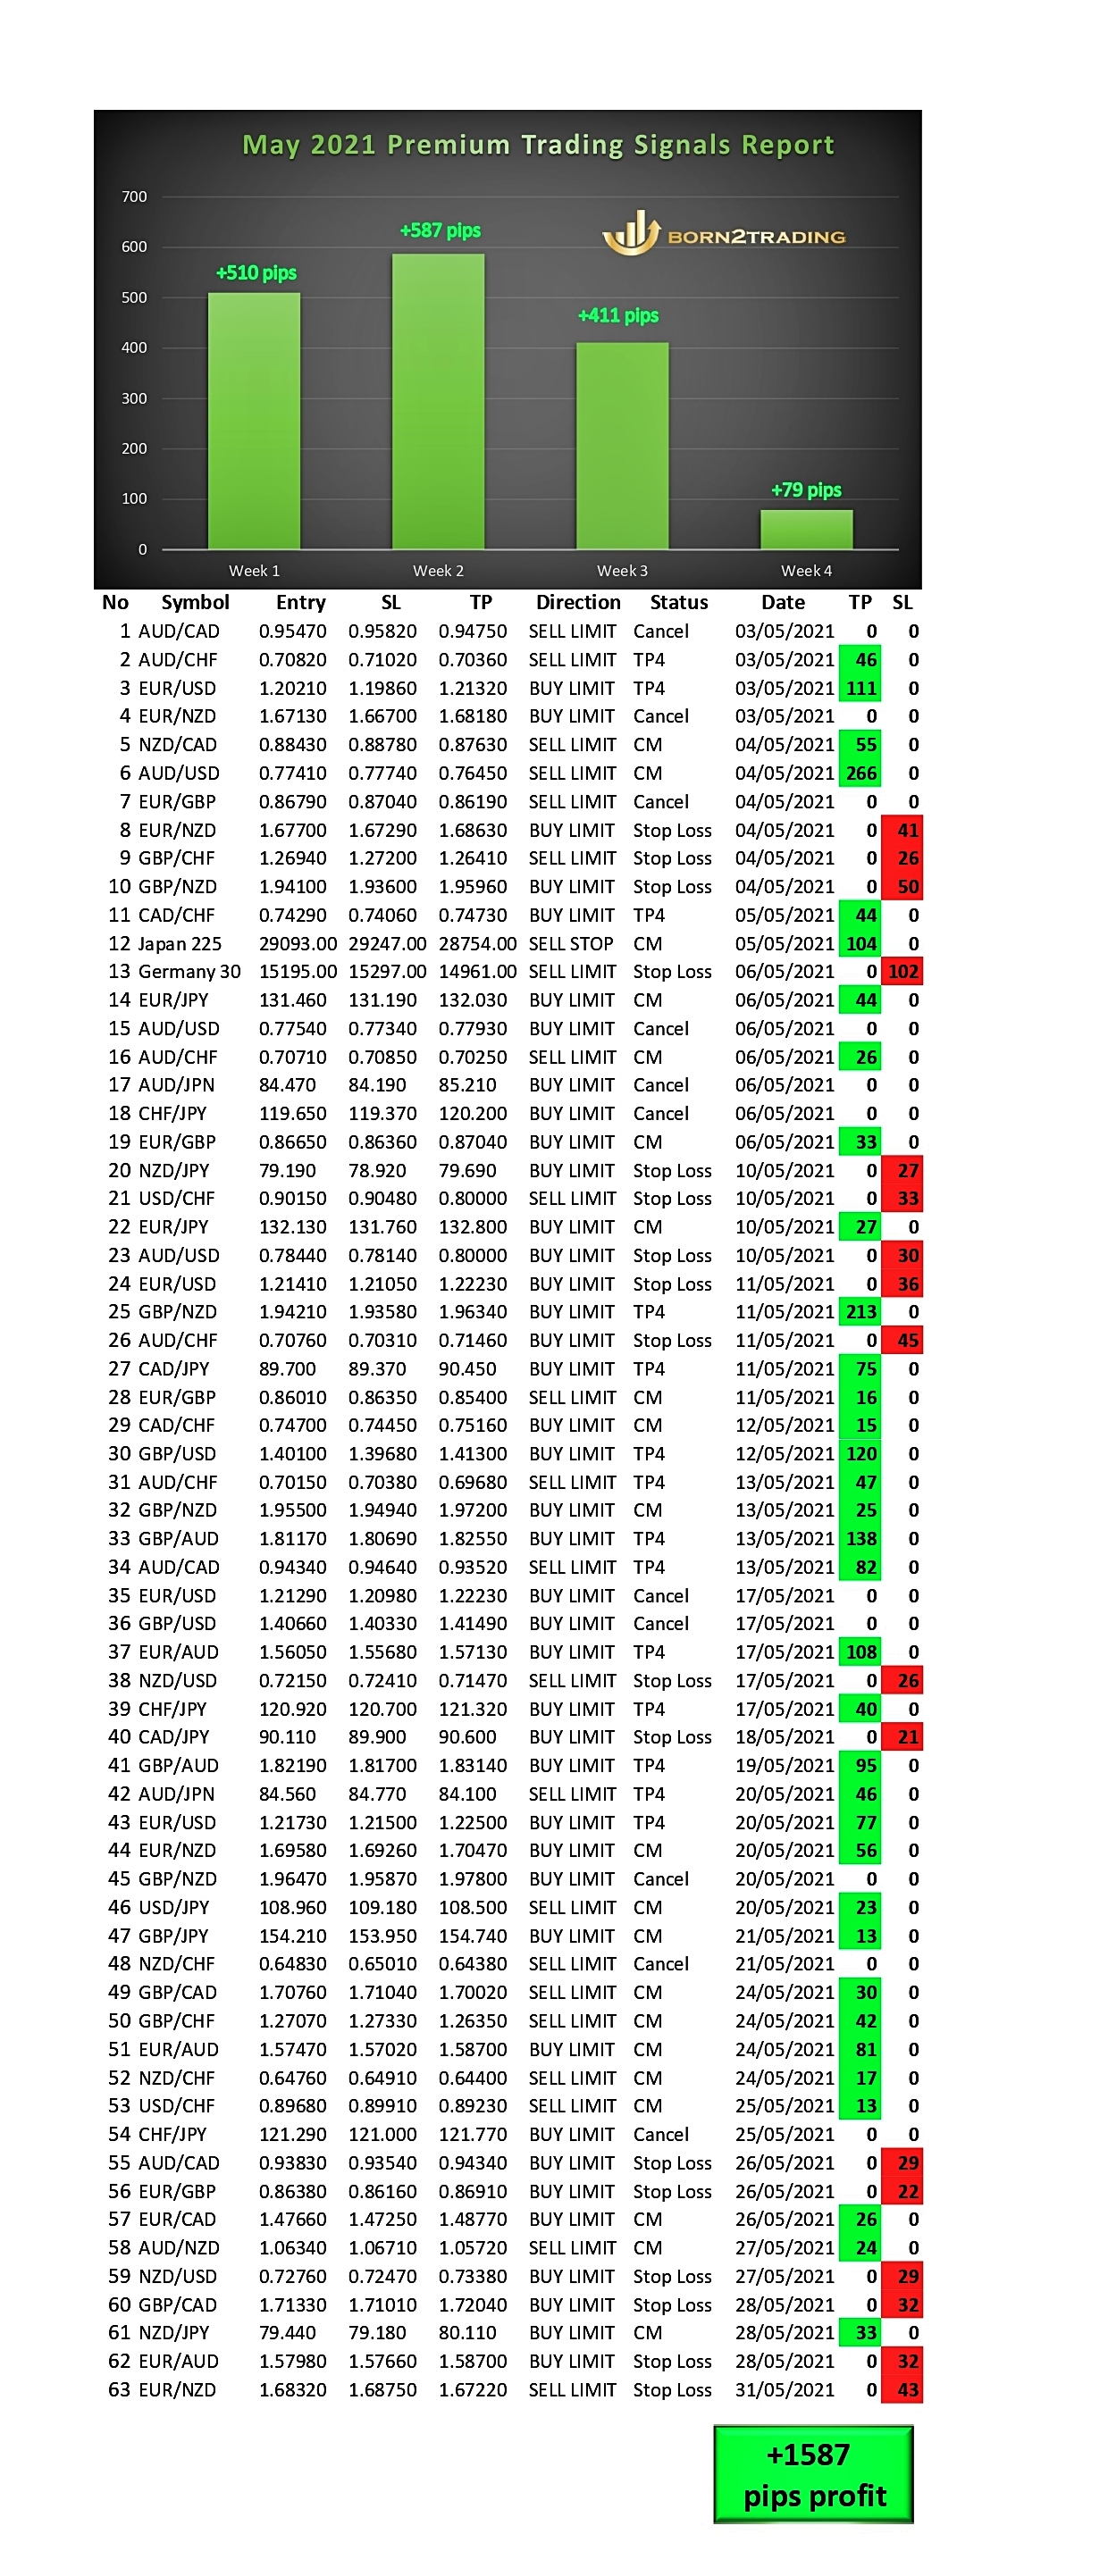
May 2021 - Trading Signals Report
Hi Traders.
Time for our monthly trading signals report.
63 generated signals
11 not executed
17 closed with stop loss
35 closed with profit
67% accuracy
We thanks all our clients for their trust and cooperation so far.
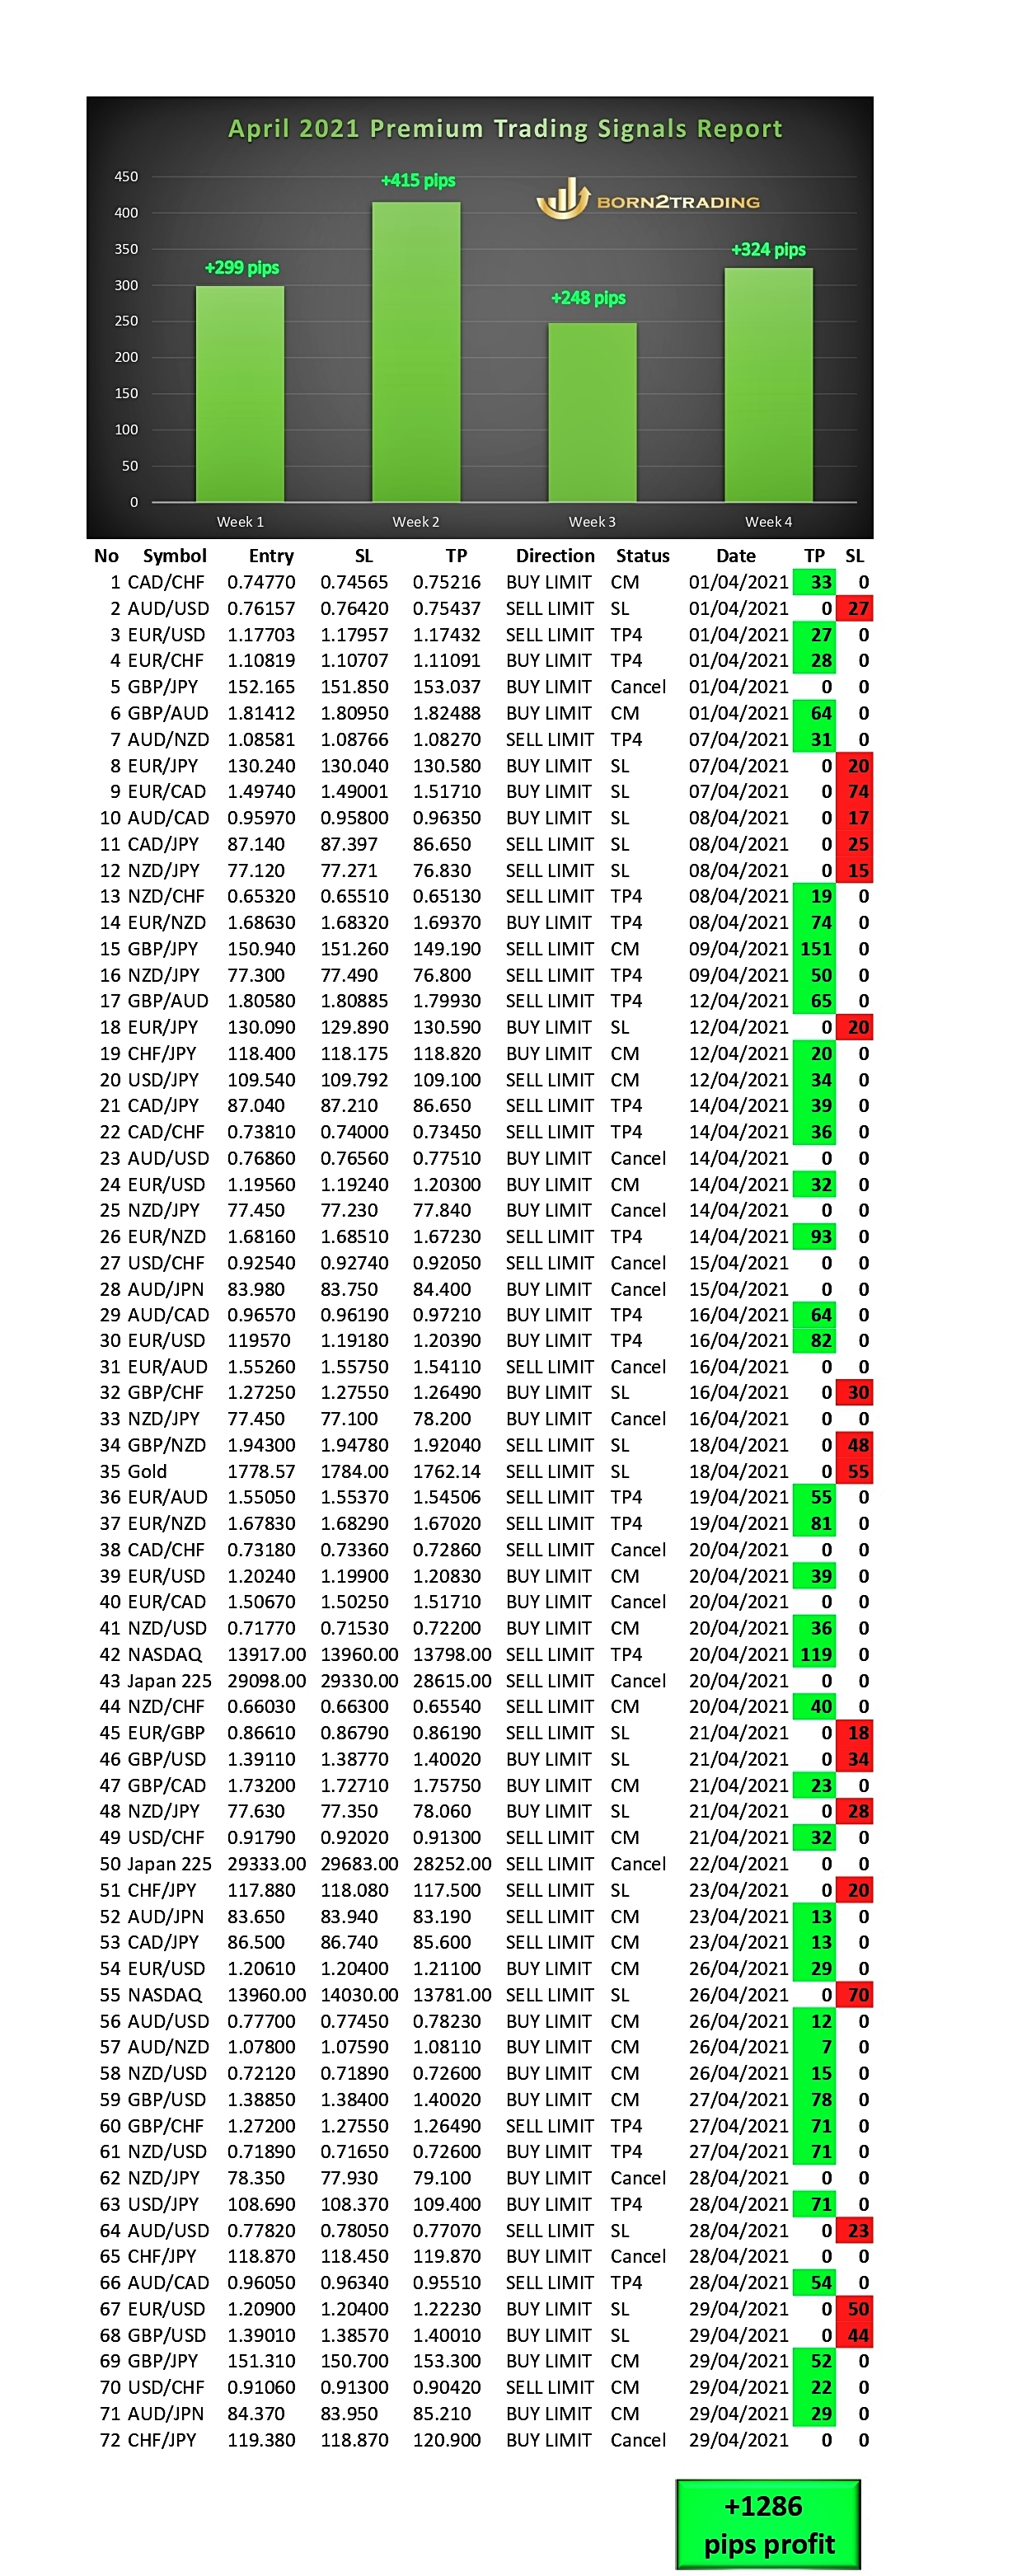
April 2021 - Trading Signals report
Hi Traders.
Time for our monthly trading signals report.
72 generated signals
14 not executed
18 closed with stop loss
40 closed with profit
68% accuracy
We thanks all our clients for their trust and cooperation so far.

January 2021 - Premium Trading Signals report
Hi Traders.
Time for our monthly trading signals report.
114 generated signals
25 not executed
20 closed with stop loss
69 closed with profit
62 pips average profit / trade
77% accuracy
We thanks all our clients for their trust and cooperation so far.
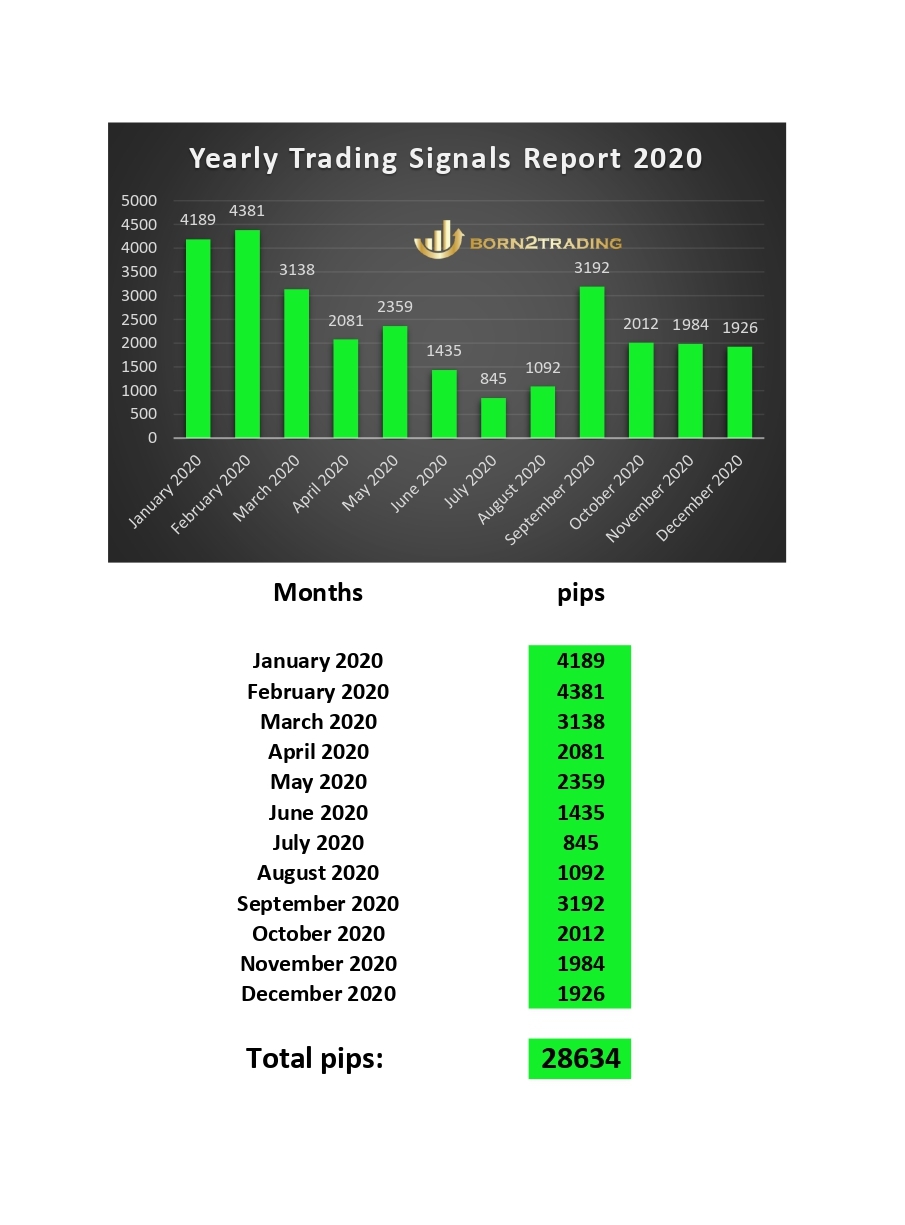
Yearly Trading Signals Report
In 2020 we made massive profit of +26634 pips .
We Thanks all our client for trust and cooperation so far.
Happy Trading

December 2020 - Trading Signals Report
Hi Traders.
Time for our monthly trading signals report.
108 generated signals
21 not executed
29 closed with stop loss
50 closed with profit
50% accuracy
We thanks all our clients for their trust and cooperation so far.

November 2020 - Trading Signals Report
Hi.
Time for our monthly trading signals report.
126 generated signals
28 not executed
33 closed with stop loss
65 closed with profit
66% accuracy
We thanks all our clients for their trust and cooperation so far.
Pay-per-trade - simple top up and trade - Buy selected Premium trading signals. No subscription required.
Copy Trade
Premium Trading signals subscription.

October 2020 - Trading Signals Report
Hello.
Time for our monthly trading recap.
133 generated signals
44 not executed
26 closed with stop loss
62 closed with profit
70% accuracy
We thanks all our clients for their trust and cooperation so far.
Pay-per-trade - simple top-up and trade. Buy selected Premium signals. No subscription required.
Copy Trade
Premium Trading signals subscription.

14 Skills & attributes part 14
What‘s uniquely interesting about the markets is that they can reward “bad trading” for a prolonged period of time.
It’s called blind luck. Lucky amateur traders might think they “got it”. They trade large positions, long and short, and they rake in profits.
But sooner or later, these wins are transferred to calculated traders who might have not collected as much during these periods but played the same old consistent long-game while calculating their risk and reward.
In the long run, you can’t win the game of day trading without accurately assessing risk and reward.
Another way to think of risk and reward is cost and benefit analysis.
Risk and reward is calculated on each trade, and on large numbers.
In day trading, your “win rate” can be low, but your positive net pay off can be more than your losses; a net profitable scenario.
Again, you need to be a long term thinker, focusing on your profits and losses over time, not just on the number of winning and losing trades.

14 Skills & attributes part 13
This is a concept that is hard for beginners to understand. “What do you mean you don’t predict? Are you not trying to predict the price?”
Price prediction is oversimplification of any type of trading. As in the famous words of Yogi Berra, “’It’s tough to make predictions, especially about the future’.”
Obviously, this is because we can’t know the future.
Day traders prepare for and react to price action based on their odds.
They’ve graduated beyond the simplistic way of thinking that an event is always a 50/50 (it’s not).
Yes, prices can only go up or down, and it’s a 50/50 chance but what leads to the rising prices or declining price are not 50/50.
For instance, at the start of a recession, where the markets are about to begin a new bear market, the odds of price reaching new highs in the near-term are less than 50% (obviously).

14 Skills & attributes part 12
Day traders can’t afford distractions. Distractions cause expensive mistakes, not only in day trading, but in life as well.
There are small mistakes that are part of the game, and there are large, foolish, and uncalculated mistakes can mean “game over” for your trading career.
One of the bigger mistakes is overreacting with a large position to a given event.
If you made that trade with the right size, and made a mistake, it would result in a small and harmless loss.
Making that same mistake with an overleveraged bet can often be catastrophic.
The right perspective teaches you to trade “by the book”, but it also gives you the flexibility to trade better when conditions are in your favor.
And, when you have the right perspective, you don’t let anyone affect your opinion. Not a “guru”, broker, chat room, forum, etc.
Perspective gives weights to information that affects your trading.

14 Skills & attributes part 11
If you decide to become a trader or investor, you have to be somewhat competitive. Day traders, especially, recognize that the main reason they win or lose is often a matter of competition.
If you are not better than your fellow day traders, you lose, period.
Many traders do not know how to evaluate themselves and how well they fit into the world of day trading, so they may go for many years without knowing where they stand.
It’s all in your P/L.
Competitive day traders gather as much information as possible because they know that day trading is, interestingly, an information management skill.
Pros win by taking advantage of uninformed players who rely on amateur decision making. Zero Sum Game (Minus Commission).

14 Skills & attributes part 10
Fear and greed move the market, but inside fear and greed you find the concepts of FOMO (fear of missing out).
Sit long enough in front of your screen, and during a quiet move, you will see the market spike up or drop just to return to normal.
These movements–largely market noise–are deceptive, triggering emotions, making you think that an inconsequential move is an important one.
We thanks to all our clients for their trust and cooperation so far.
https://born2trading.co.uk
Pay-Per-Trade - simple top-up and go, just buy selected Premium signals , no subscription required.
COPY TRADE :
£59.99 / Month
£19.99 / Week
Telegram Channel:
https://t.me/born2tradingfree

September 2020 - Trading Signals Report
All right guys, time for our monthly trading recap.
130 generated signals
34 not executed
23 closed with stop loss
73 closed with profit
43 pips average profit/trade
76% accuracy
Trade Safe!
We thanks to all our clients for their trust and cooperation so far.
Pay-Per-Trade - simple top-up and go, just buy selected Premium signals , no subscription required.
COPY TRADE :
£59.99 / Month
£19.99 / Week
Telegram Channel:
https://t.me/born2tradingfree

14 Skills & attributes part 9
Amateur day traders either do not plan, or they do not plan well. They rely on their impulses and habitual behaviors. Professionals plan on many levels and across various time periods.
Tomorrow’s day session
The current environment
The short term trend
The long term trend
When you plan as above, you should not be surprised by the actions of others. These actions make you set objectives and react to situations whether the market is in your favor or not. This planning will also allow you to be aggressive when your levels are spot on, taking a more of a risk-on approach when the situation calls for it.
Day traders think like chess players. “I will do this, and if the market does this, and I will do that!” This way, you set clear goals, think of what other markets players might do, plan the actions that will move you toward your goals, and always know the rationale behind your moves.
Day trading makes you think of contingencies. Not just one contingency, but multiple ones, as the market is fluid. This means that while prices can go up and down the rhythm of the market can change, and price fluctuations and trends can accelerate and decelerate (momentum).
Day traders consider a wide range of possibilities. Should something unexpected happen, they know how to react. Keep asking “What if?” way before it happens.

14 Skills & attributes part 8
You can lose far more trades than you win. Either way, you can end up with a net gain or loss. Losing sessions and losing streaks are just part of day trading. If you need to break even faster than the market wants to give it to you, this could lead to more losses.
Successful day traders accept losses and continue to trade a solid, patient game: Not adjusting size or adding to losing positions if it’s not part of the strategy, and not letting their emotions or impulsivity take over their trading.
The difference between winning and losing can sometimes boil down to “paralysis effect” resulting from an inability to calculate the odds. They let their small losses paralyze them, preventing them from taking potentially winning trades. This is how they max out their losses and minimize their wins.
Professional traders know the average losing streak of their game and understand that while there are no guarantees, the market could also hand them favorable conditions that are in line with their method.
Short-sighted thinking and an inability to understand the fluidity of win/loss ratios, can lead to internal conflicts that can disrupt one’s trading.
Pros do not take conflict personally. Sadly, many amateurs never learn this valuable lesson.
When you play against the market you could be “bluffed”, and its part of the game of day trading. How you react to these events will determine your success, because your mental capital is just as important as your financial capital. Day trading teaches you not to take self-destructive actions because these are the actions that drain your energy and remove your focus.

14 Skills and attributes part 7
Beginners ask professionals “How do you handle this situation? Or this situation..?” or “What do you do when…?” Yet, they don’t like it when they get the answer: “it depends”. The reason is that amateurs don’t understand context. Day trading without understanding context can be fatal to your account.
How so? Context makes you ask the question “How is this situation different?” Amateurs place the same importance on every scenario. Professionals with seasoned day trading skills always adjust their thinking and positions because the market is always changing. It changes volatility, ranges, direction, and bias.
A trader may get into a trade with odds in his favor while 5 minutes later the odds change, warranting an exit. They don’t just sit there and wait for their profit to turn into a loss; they know how to exit when the edge is gone.
Let’s use an example. A Pro day trader decided to short the market because the trend was bearish for the day, and then an immediate sharp violent trend to the upside began. The trader now needs to assess whether a trend has reversed or if stops were hit, squeezing out the “shorts.” Ask a trader one day and he may say it’s a short squeeze and another day he’ll say the trend reversed.
Again, the context of the market will dictate: Size of the move, how long the reversal lasts, and how it correlates to the price action that day. Day trading makes you adjust to new situations by evaluating them minute by minute. Day trading forces you to cope with a lot of change in a short amount of time.

14 Skills and attributes part 6
As a day trader, you keep an eye on potentially huge risks. For example, you may think you have great odds in a given trade, and you may think of going “all in,” but logic and discipline tells you there could be a variable that you didn’t consider or an event that may bring your trading career to a halt if you are too leveraged.
Pros always keep at the back of their minds the one-off event they couldn’t anticipate. In light of this, they balance their approach. They know they can only control the size before the trade, and they trade according to that. Pros don’t have crystal balls; they don’t need them.
Professional day traders respect the market by respecting risk. They assess complicated situations and ask themselves these questions:
What does the market think?
What are other traders doing?
What is the probability of the market going up or down?
Am I being realistic now?
How much do I stand to win or lose?
That is their way of staying grounded in reality.

14 Skills and attributes part 5
Day traders focus on Positive Expectancy. Their focus is not necessarily time-based–minutes, hours, days or weeks. This gives day trading a completely different outlook. They are not short sighted, and a profitable day or a losing day is not a reason to feel “happy” or “depressed.” In fact, their winners are associated with relief. But that could be an entirely different topic.
You could make money despite bad decisions (it’s called luck), but if you do not have the edge of positive expectancy, you will not come out positive in the long run. Your goal as a trader is to have Positive Expectancy over Negative Expectancy. This means that each trade as a single trade should not play a role in your success of failure.
This also means that part of the discipline above is to take each trade set up. If you have the set up or levels and decide not to be in the trade based on feelings, you will soon realize that not taking a trade has a cost.
In day trading, any trade missed can mean a loss if only through opportunity cost. Opportunity cost removes the potential for positive expectancy. When odds are in our favor, you take the trade!
The discipline of day trading teaches that lost profits are objectively the same as losses.

14 Skills and attributes part 4
There are no undisciplined yet successful day traders. Day traders are extremely disciplined and have learned to eliminate the destructive traits that prevented them to achieve day trading excellence.
You need to develop a set of very unique day trading skills to be a day trader, but it does not matter how skilled you get, if you do not have the specific kind of discipline to trade intraday, you will not get to the level of mastery in day trading without discipline and self control.
Day traders are not “trigger happy” but instead they wait for their setups and avoid price temptations. They avoid market conditions they do not understand, and they can stay out of the “game” for as long as necessary. They don’t criticize markets with the same old “the market is rigged”, “the market is wrong” (all of them excuses) and the “the players don’t understand the economy”.
In short, they don’t blame others for their own flaws (something that most people, trader or not, tend to do). All these reactions are emotional, and that is the one thing they do not wish to do. Instead they have self-control; at levels, most day traders only wish to achieve.

14 Skills and attributes part 3
The majority of us think we make good decisions, but in reality, we make decisions based on poor assumptions or intuitions which are emotionally driven or uncritically biased.
Day trading is essentially a puzzle of variables and you have to apply logic to put all these pieces together.
Logic also tries your patience, because you have to wait for all the right conditions to “meet”. If you are patient, you may have an advantage over impulsive people who over trade, often afraid to miss out on the next move (FOMO). Ultimately, if you go about it diligently and prudently, there are many day trading benefits to be had.
We thanks to all our clients for their trust and cooperation so far.

14 Skills and attributes part 2
Day trading does not require you to be good just in one thing. Day trading skills are multifaceted and far reaching.
Instead you become a person who is engaged in studies of risk and reward, logic, psychology, and mathematical probability–not in a theoretical way but in a pragmatic sense.
You can’t be the “best” in all these fields, and you may be better in one domain over another, but you still need to develop workable day trading skills in all these domains.

14 Skills and attributes part 1
Day-traders get immediate feedback on the decisions they make. Some day traders place hundreds of trades per day, and the results could potentially accelerate their learning ability as they learn fast and frequently as to what decisions work and what does not.
The situation that results in positive outcomes could be carried over to the next trading sessions. The same applies to the negative results that provide great feedback on your trading skills or personal attributes.
For example, if you are not logic driven, overly impulsive, and unable to analyze risk and reward under pressure, you likely won’t be able to succeed in day trading; you won’t acquire the necessary day trading skills to acquire the day trading benefits that’ll allow you to continue successfully day trading.
Day trading will teach you how important it is to control your emotions and to stay cognitively sharp. It also highlights the tension between cold decision-making and “gut” intuition, as both can conflict. Most importantly, day trading teaches you to think before you act.

Premium Trading Signals results - August 2020
All right guys, time for our monthly trading recap.
As you can see in the report we had a bit choppy beginning with a few stops on the start caused by unpredictable market conditions.
However after few adjustments we was able to recover our losses and finish month with profit.
Trade safe!
125 generated signals
34 not executed
25 closed with stop loss
65 closed with profit
27 pips average profit / trade
71% accuracy
We thanks to all our clients for their trust and cooperation so far.
Pay-Per-Trade - simple top-up and go, just buy selected Premium signals , no subscription required.
COPY TRADE :
£59.99 / Month incl access to Premium signals and Premium Telegram Channel.
£19.99 / week incl access to Premium signals and Premium Telegram Channel.
Channels - Trading Pattern
Channels are striking due to their near symmetrical progression.
However, although they’re easy to identify in retrospect, they’re hard to forecast.
But if you do identify a market that appears to be channeling, you can use many different approaches to trading a channel–from going long and short to adding successive positions to using it as a measure for entries and exits.
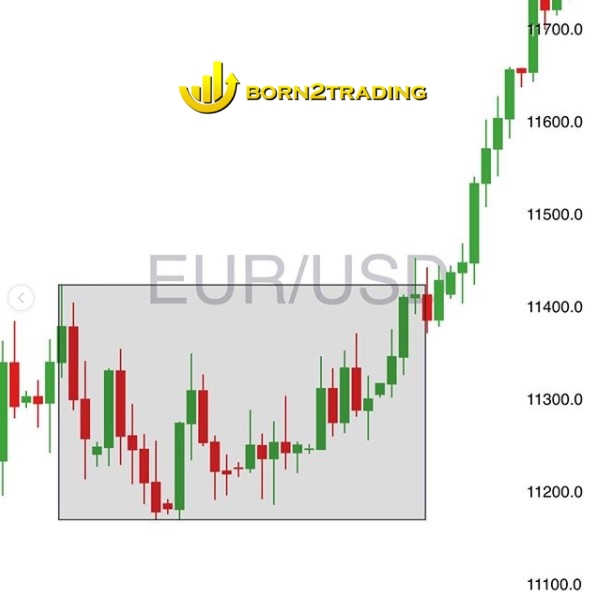
Rectangles Pattern
Not all rectangles are perfectly clean, with support and resistance levels lining up perfectly.
But in most cases, rectangles are easy to spot.
They’re essentially trading ranges from which price will eventually breakout (either direction).
Hence, they provide traders the opportunity to play either side of the market.
Ross Hook Pattern
Coined by the famed trader, Joe Ross, the Ross hook may not be the most well-known chart pattern, but it is one of the most frequent and reliable patterns that day traders and swing traders can use to exploit short-term market opportunities.
Ross hooks are simply pullbacks that occur after having made a breakout (toward the upside or downside) continuing the current trend.
Sounds easy? Well, it is, and that’s what makes the pattern both reliable and effective.
Better yet, these patterns show up almost everywhere and in every time frame, expanding a trader’s horizon of opportunity.
How do you trade it? Enter upon a breakout of the hook.
Flags Pattern
Flags are a classic trend continuation pattern and they can often be found on the intra-day time frames.
Day traders often rely on flags as tradable events.
Flags look like small rectangles usually tilted against the main trend and mounted on what appears like a flagpole.
The main thing is that flags tend to go against the prevailing trend.
So a bearish flag is often tilted upward, while a bullish flag is often tilted downward as illustrated in the next charts.
Triangles Pattern
Triangles are a form of consolidation or range pattern where markets just drift sideways for an extended period of time.
Triangles can come in many different forms and shapes.
In contrast to the other patterns, triangles–especially symmetrical ones–are neutral, and they are neither trend continuation nor reversal patterns.
They simply show that the market is in a contracting stage without conviction and directional impulses.
The signal on triangles occur once price leaves the pattern.
Often, those breakout points come with high momentum candles and moves.
The tighter and longer a consolidation in a triangle lasts, the stronger the breakout and the following trends.
Saucers or cup and handle patterns
Saucers or cup and handle patterns are longer-term reversal patterns where a gradual shift in the trend direction is happening.
Usually, you can also find a head and shoulders at the bottom/top of such a saucer pattern, but in contrast to the head and shoulders, the transition happens much slower.
The transition from lower lows and lower highs to higher highs and higher lows is obvious in such a pattern and the saucer pattern can often foreshadow a longer lasting trend reversal.
Pay-Per-Trade - simple top-up and go, just buy selected Premium signals , no subscription required.
COPY TRADE :
£59.99 / Month incl access to Premium signals and Premium Telegram Channel.
£19.99 / Week incl access to Premium signals and Premium Telegram Channel.
Pennants Pattern
Pennants are essentially small symmetrical triangles.
They can approach the trend from almost any direction and often occur after long trending periods when price pauses and traders reposition themselves.
Most traders make the common mistake of jumping on premature signals.
Instead, wait for the actual confirmation that price is breaking out of such a pattern. Usually, the breakout signal happens with a violent and strong candle indicating that the trend is ready to resume.
Pay-Per-Trade - simple top-up and go, just buy selected Premium signals , no subscription required.
COPY TRADE :
£59.99 / Month incl access to Premium signals and Premium Telegram Channel.
£19.99 / Week incl access to Premium signals and Premium Telegram Channel.
Head & Shoulders - Trading Pattern
Similar to the double top, the head and shoulders pattern is another popular pattern that traditionally signals a bearish reversal.
The pattern tells that three attempts to break toward the upside have failed, the middle attempt (the head) having the strongest momentum.
The trick in trading this pattern is to wait until the “neckline” has been violated. Often price will rise to meet the neckline one last time before declining.
Very important is to remember that patterns are not often “clean” and can also have irregular shapes.
Nevertheless, once price broke below the neckline of the last shoulder, the pattern performed as traditionally expected.
V top & V Bottom Pattern
V tops and bottoms are quite straightforward but they’re also very easy to miss.
If you are looking to trade the top or bottom of a market, double tops or bottoms are typically easier as they provide more info (failure to make a new high or low) and two chances for entry.
Not so much with V tops and bottoms. In a case like this, it helps to understand the fundamentals behind a market to better assess whether a market is going to break down or recover.
Double Top Pattern
A double top is a bearish pattern that can occur frequently in the markets across different time frames. The big question with a double top is how deep a market can fall upon failing to break out of the peak.
To potentially increase your chances of success trading this pattern, you might want to wait for confirmation either way. You can always jump on a double top–anticipating its traditional bearish outcome or betting on a breakout toward the upside, but if you do, be sure to place a stop above resistance (if bearish) or support (if hold a contrarian bullish bias).
In the example a double top on the hourly chart might have resulted in a nice short-term downtrend. Waiting for price to break the support line and placing a stop above the highest peak could have resulted in a strong trade on the short side.
Pay-Per-Trade - simple top-up and go, just buy selected Premium signals , no subscription required.
COPY TRADE :
£59.99 / Month incl access to Premium signals and Premium Telegram Channel.
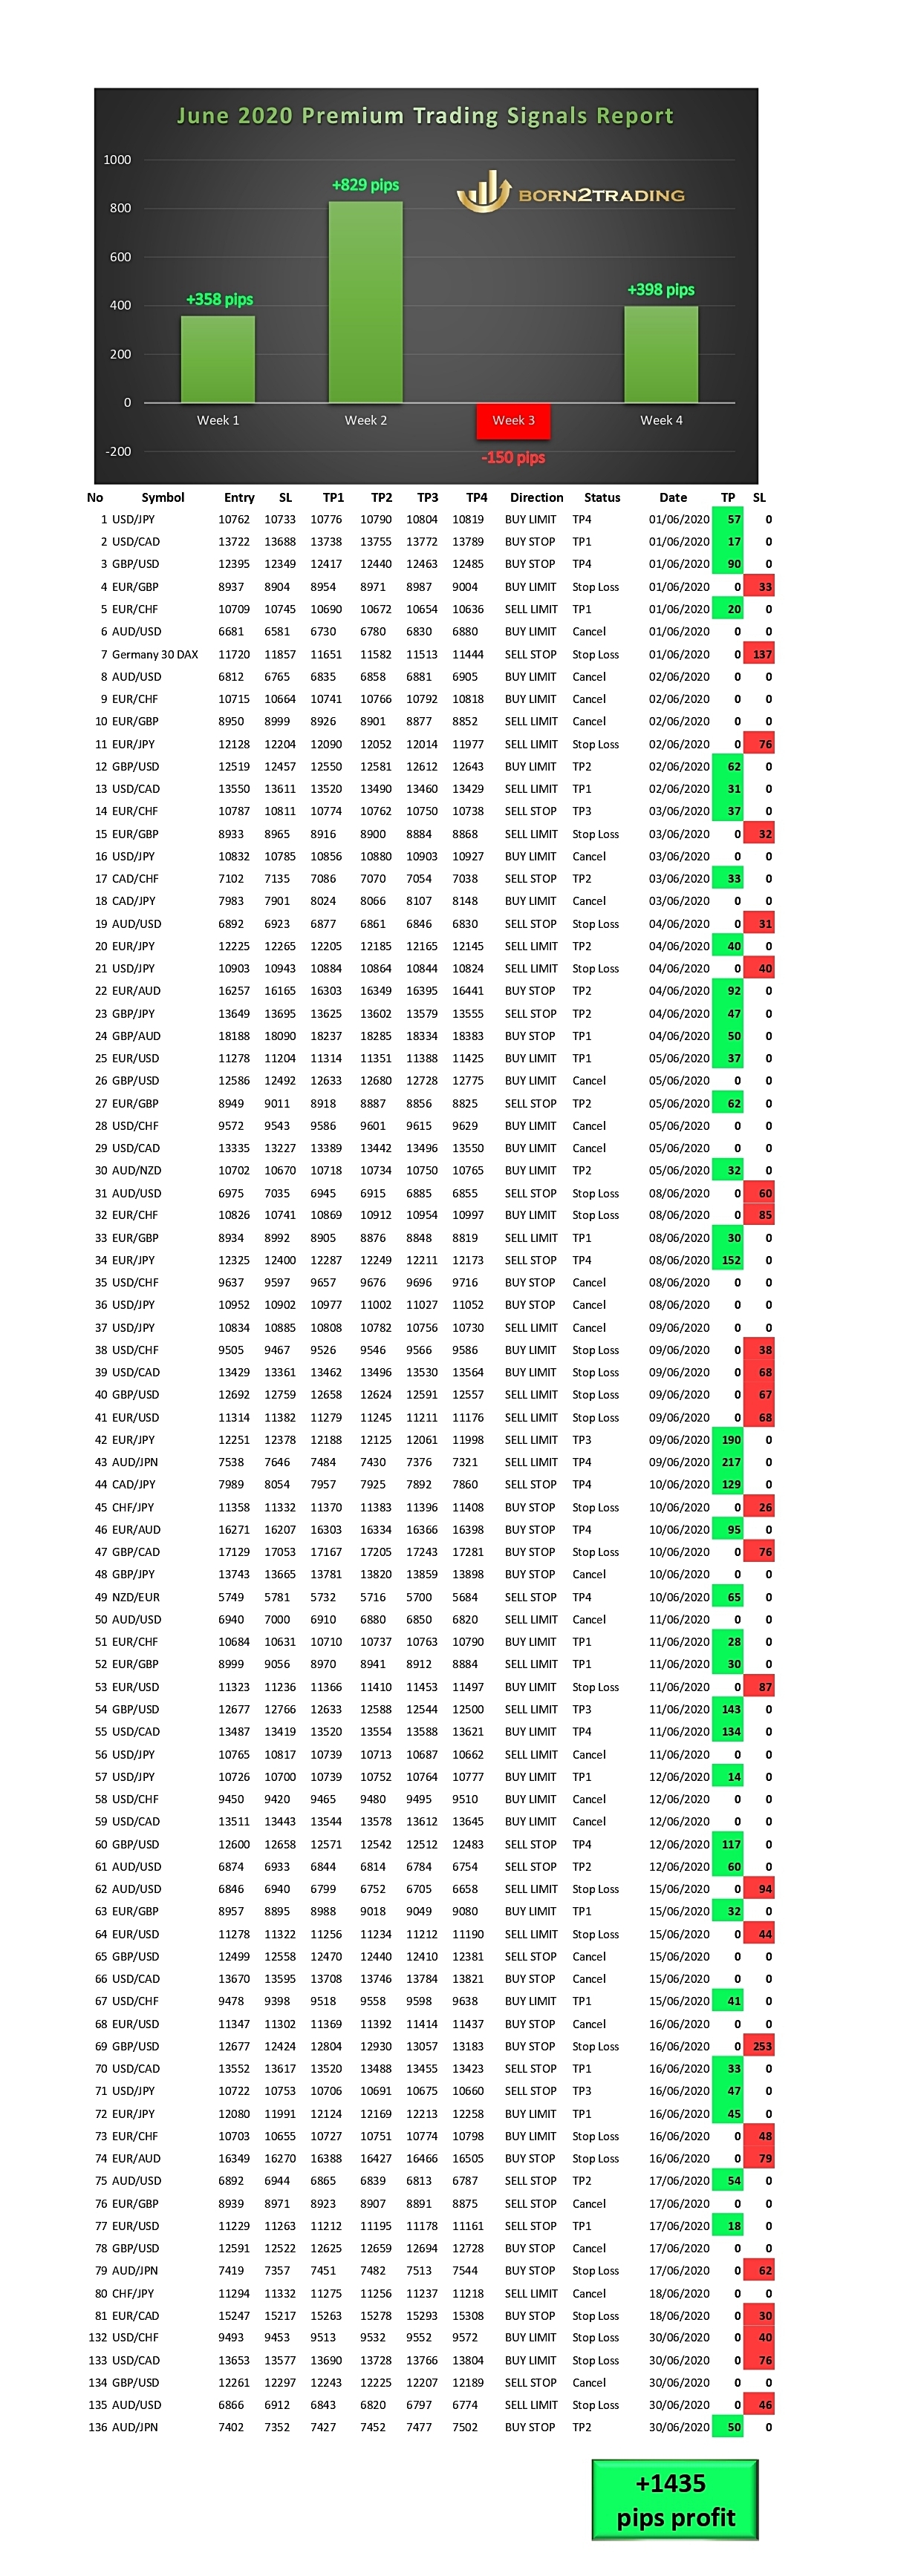
June 2020 - Premium Trading Signals Report
Hello Traders.
Here is our Premium Trading Signals Report for May 2020.
We've made +1435 pips profit.
136 generated signals
31 not executed
36 closed with stop loss
69 closed with profit
72% accuracy.
We thanks all clients for their trust and cooperation so far.

May 2020 - Premium Trading Signals Report
Hello Traders.
Here is our Premium Trading Signals Report for May 2020.
We've made +2359 pips profit.
143 generated signals
44 not executed
26 closed with stop loss
71 closed with profit
34 pips average profit per trade
73% accuracy.
We thanks all clients for their trust and cooperation so far.
ECB increase PEPP by EUR 600B
ECB announced to increase the pandemic emergency purchase programme (PEPP) by EUR 600B to a total of EUR 1350B today. Purchases will continue to conduct in a “flexible manner over time, across asset classes and among jurisdictions”.
Also, the horizon of PEPP net purchases will be extended to “at least the end of June 2021”. Additionally, “the Governing Council will conduct net asset purchases under the PEPP until it judges that the coronavirus crisis phase is over.” Maturing principal payments will also be reinvested “until at least the end of 2022”.
Asset purchase programme net purchase will continue at a monthly pace of EUR 20B and it’s expected to “run for as long as necessary”. Reinvestments of principal payments will also continue, “for an extended period of time”.
Interest rates are held unchanged, with the main refinancing rate at 0.00%, marginal facility rate at 0.25% and the deposit rate at -0.50%.
In the post-meeting press conference, ECB President Christine Lagarde said economic data have shown some signs of a “bottoming-out” in the economy, alongside the gradual easing of coronavirus containment measures. But “the improvement has so far been tepid compared with the speed at which the indicators plummeted in the preceding two months.”
In the baseline scenario of new economic projections, GDP is expected to fall by -8.7% in 2020 (revised down by -9.5% from March projections), then rebound by 5.2% in 2021 (revised up by 3.9%) and 3.3% in 2022. Balance of risks is to the downside.
AUD/USD Daily Outlook
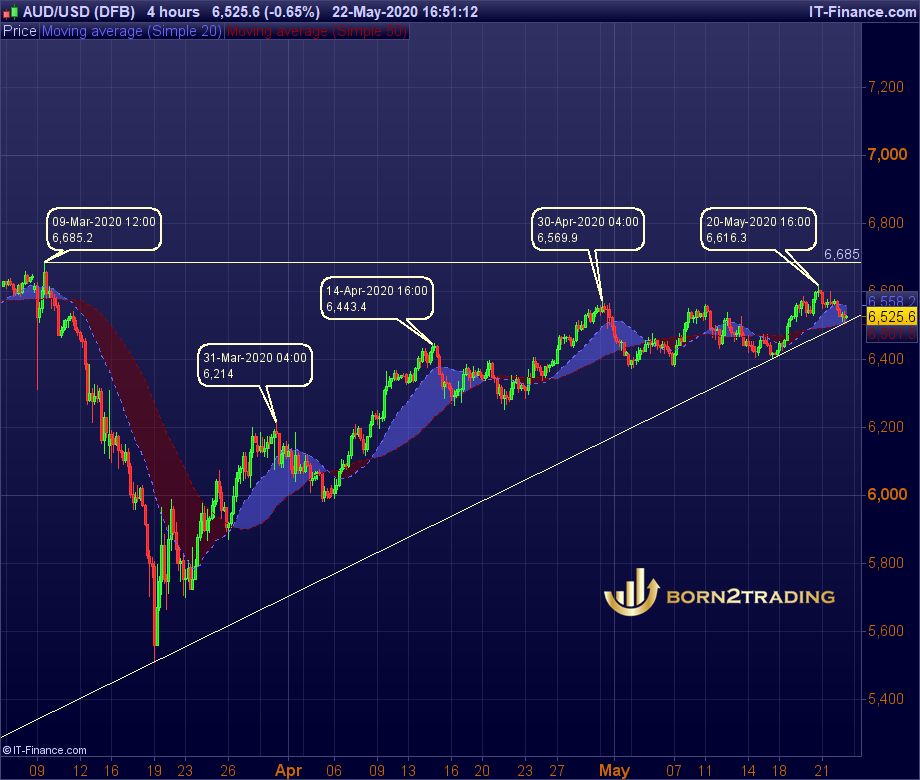
Technically AUD/USD is still holding on to 4h MA50 (right
now at 6,525) and thus maintaining near term bullishness. Sustained break of
the MA50, will firstly indicate short term topping a turning focus on 6,402
support for confirmation. On the upside break of the level, 6,616 will indicate
retest 6,685 resistance level.
EUR/USD Daily Outlook
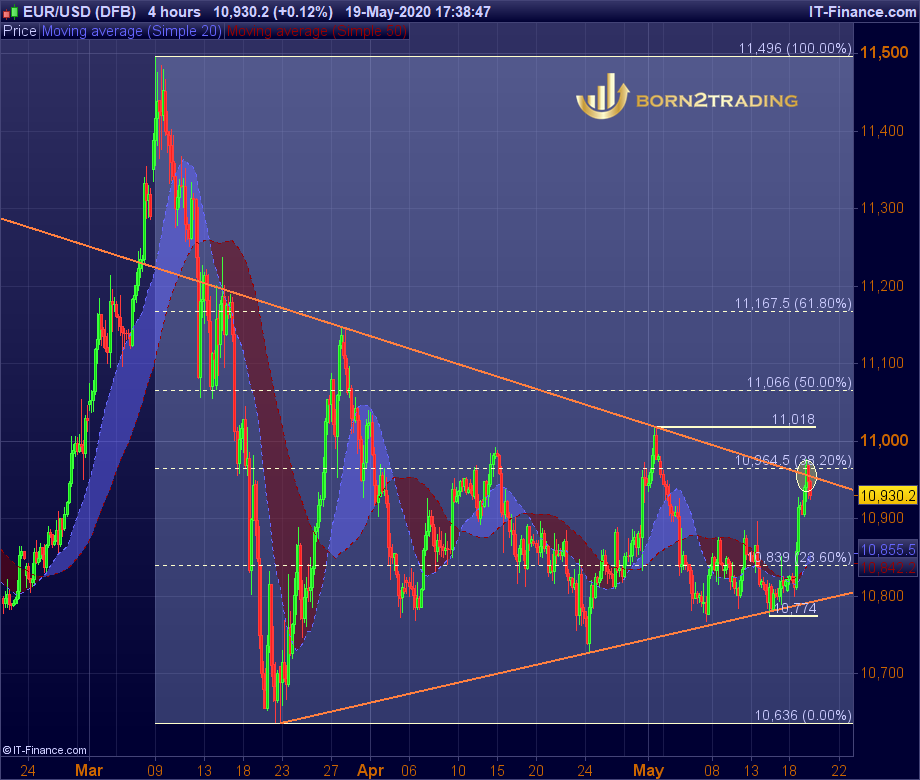
Daily pivots: (S1)10,835; (S2)10,754; (S3)10,708;
(P)10,881; (R1)10,962; (R2)11,008; (R3)11,089
Intraday bias on EUR/USD remains mildly on the upside at this point. Further rise could be seen to 11,018 resistance and above, but upside should be limited by 61,8% retracement of 11,496 to 11,636 at 11,066 level. On the downside, a break of 10,774 should turn bias back to the downside for retesting 10,636.
Pay-Per-Trade How it works video
GBP/USD Daily Outlook
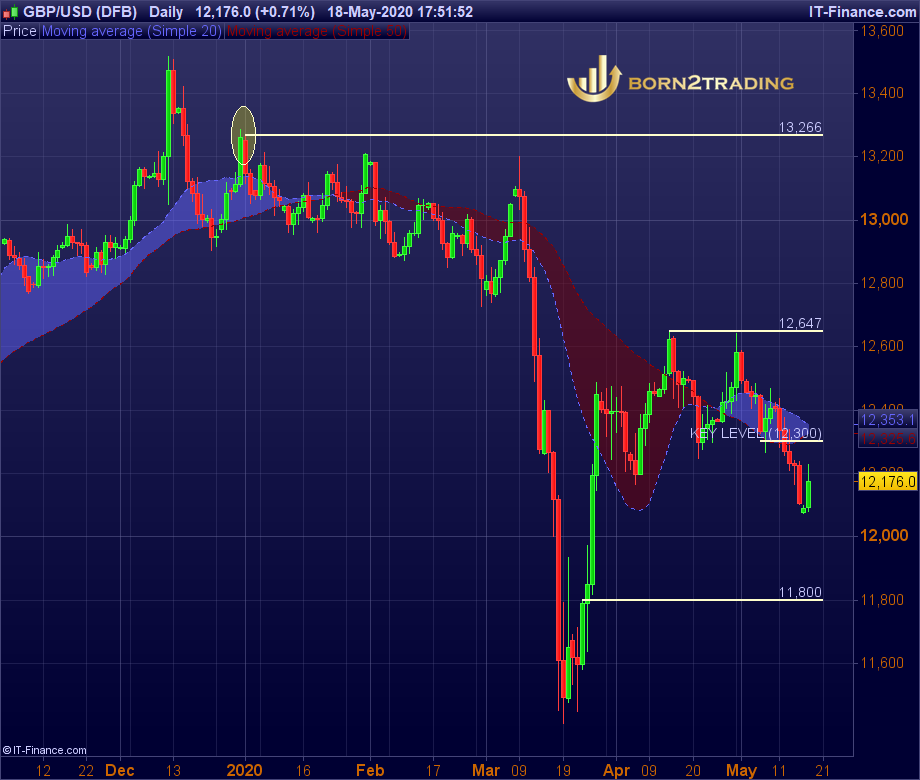
Daily Pivots: (S1)12,057; (S2)12,010; (S3)11,919;
(P)12,148; (R1)12,194; (R2)12,285; (R3)12,332
The GBP has started the new trading week with a bearish
tone against the US dollar after the pair suffered its largest weekly decline in
nearly eight weeks. The GBP/USD. To push the price higher, bulls must defend
this week 12,000 level (is 50% retracement from the April monthly high to the
current year low) otherwise the most likely price would be tested 11,800 level. Key
level 12,300.
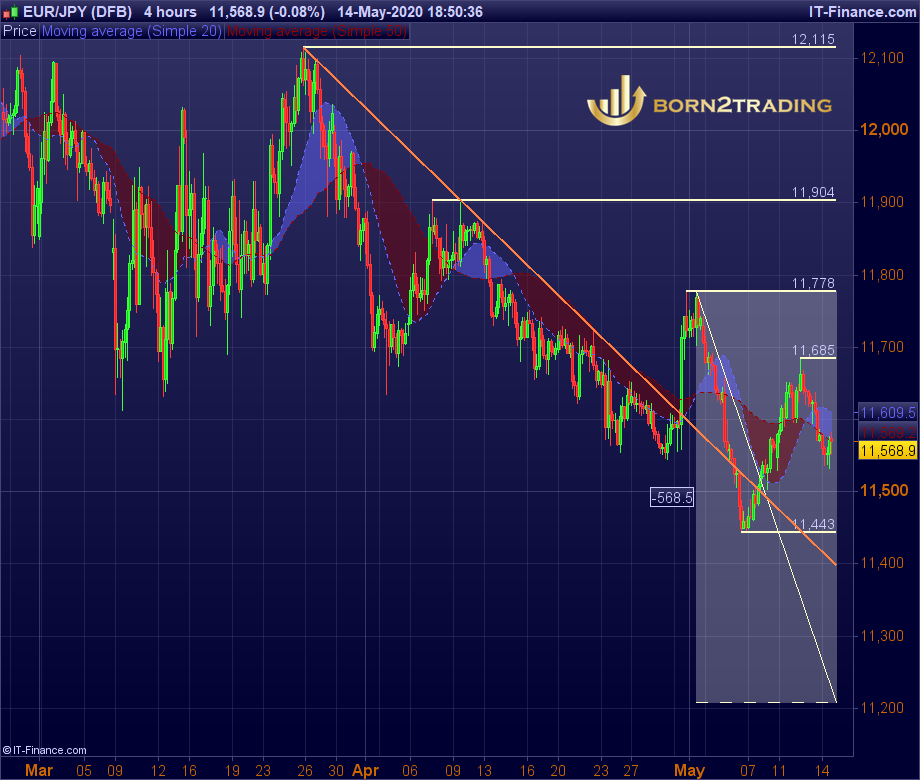
EUR/JPY Daily Outlook
Daily Pivots: (S1)11,551; (S2)11,524; (S3)11,480;
(P)11,595; (R1)11,622; (R2)11,667; (R3)11,693
Intraday bias in EUR/JPY remains neutral for the moment.
Corrective recovery from 11,443 might extend. But upside should be limited well
below 11,778 resistance to bring down trend resumption. On the downside, the break
of 11,443 should target 11,207.
In the bigger picture, the
downtrend from 137.49 (2018 high) is still in progress. EUR/JPY continues to
stay well inside the falling channel and below falling 55-week EMA. Deeper fall
could be seen to retest 109.48 (2016 low) next. On the upside, break of 122.87
resistance is needed to confirm medium term bottoming. Otherwise, outlook will
stay bearish in case of rebound.
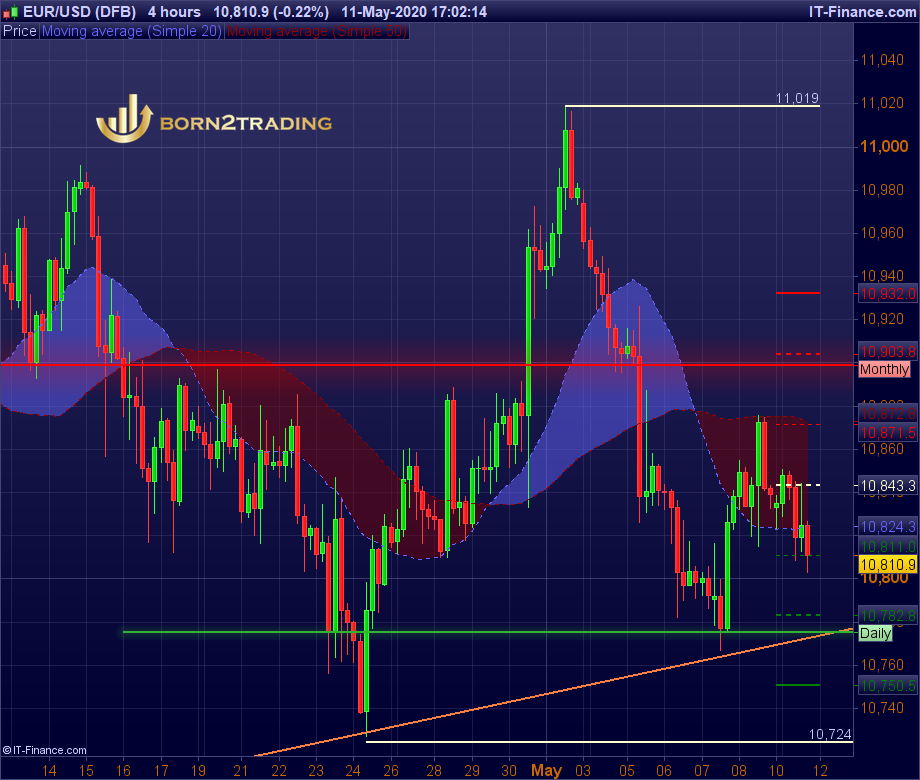
EUR/USD Daily Outlook
Daily Pivots: (S1)10,811; (S2)10,872; (S3)10,750; (P)10,843;
(R1)10,871; (R2)10,903; (R3)10,932
Outlook in EUR/USD remains
unchanged and intraday bias stays neutral. Corrective pattern from 10,635 could
extend further. On the upside, above 10,899 minor monthly resistance will turn
bias to the upside for 11,019 resistance. But overall, upside should be limited
by 61.8% retracement of 11,496 to 10,635 at 11,167. On the downside, break of 10,727
will target a test on 10,635 low.
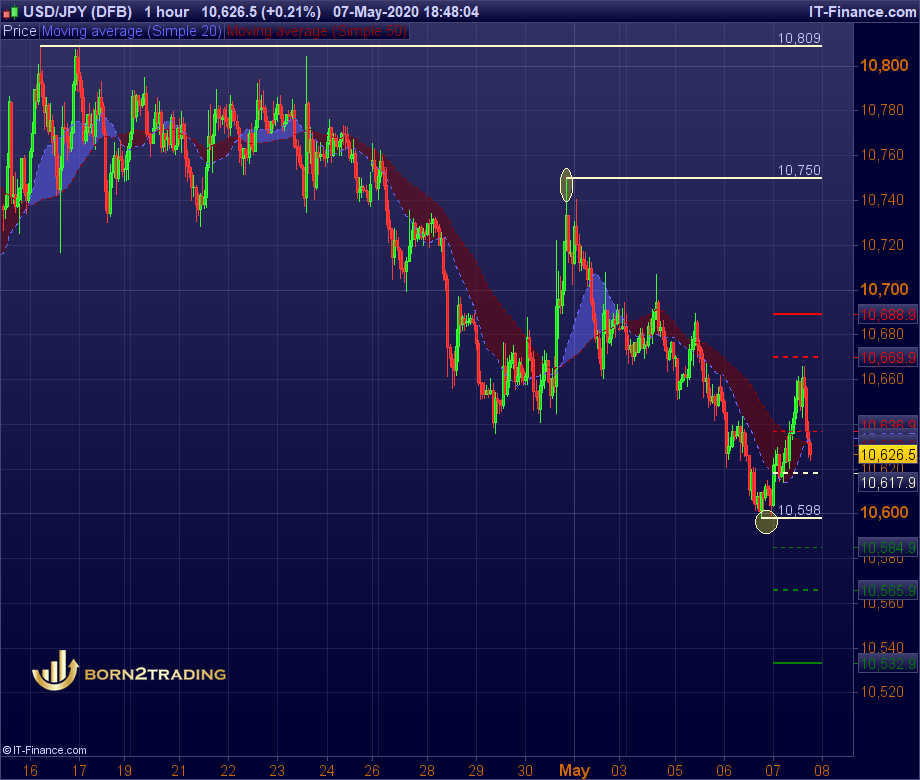
USD/JPY DAILY OUTLOOK
Daily Pivots: (S1)10,584; (S2)10,565; (S3)10,532; (P)10,617; (R1)10,636;
(R2)10,669; (R3)10,688
A temporary low is formed at 10,598
in USD/JPY and intraday bias is turned neutral first. Further decline is
expected as long as 10,750 resistance holds. Reactions from 10,598 could
finally reveal whether fall from 10,750 is corrective or impulsive. On the
upside, the break of 10,750 resistance will indicate short term bottoming and turn
bias back to the upside for 10,809 minor resistance and further major
resistance at 10,938 level.
Pay-Per-Trade How it works video
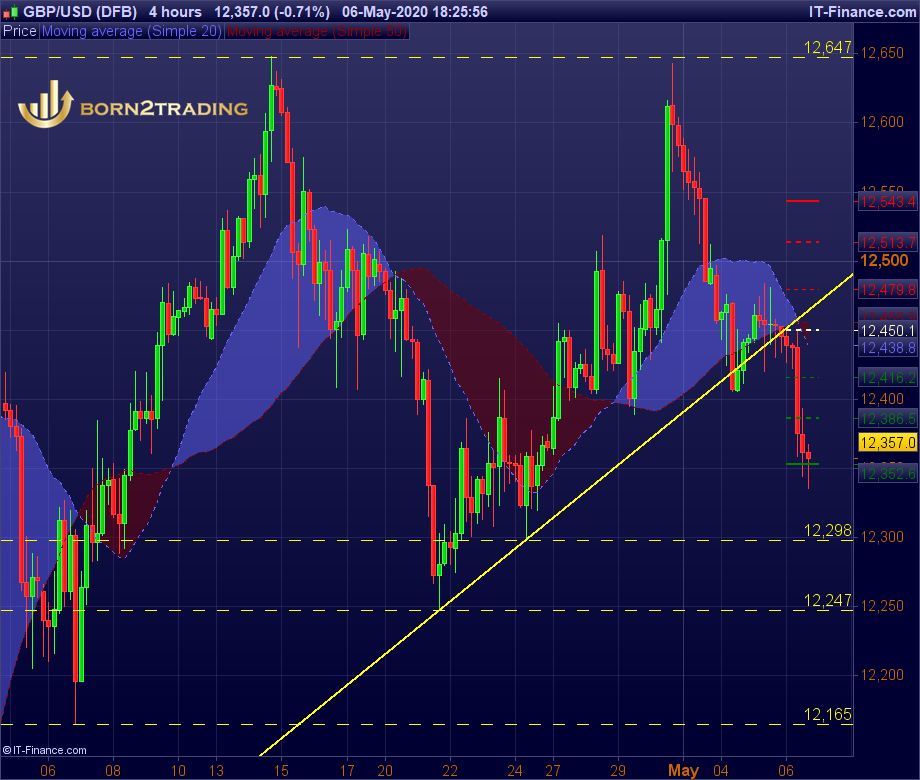
GBP/USD Daily Outlook
GBP/USD Daily Outlook
Daily Pivots: (S1)12,416; (S2)12,386; (S3)12,352;
(P)12,450; (R1)12,479; (R2)12,513; (R3)12,543
GBP/USD is still bounded
in range of 12,247-12,647 and intraday bias remains neutral. Further rise is in
favour as long as 12,247 support holds.
On the downside, break of
12,247 support will indicate a test of 12,165 level.
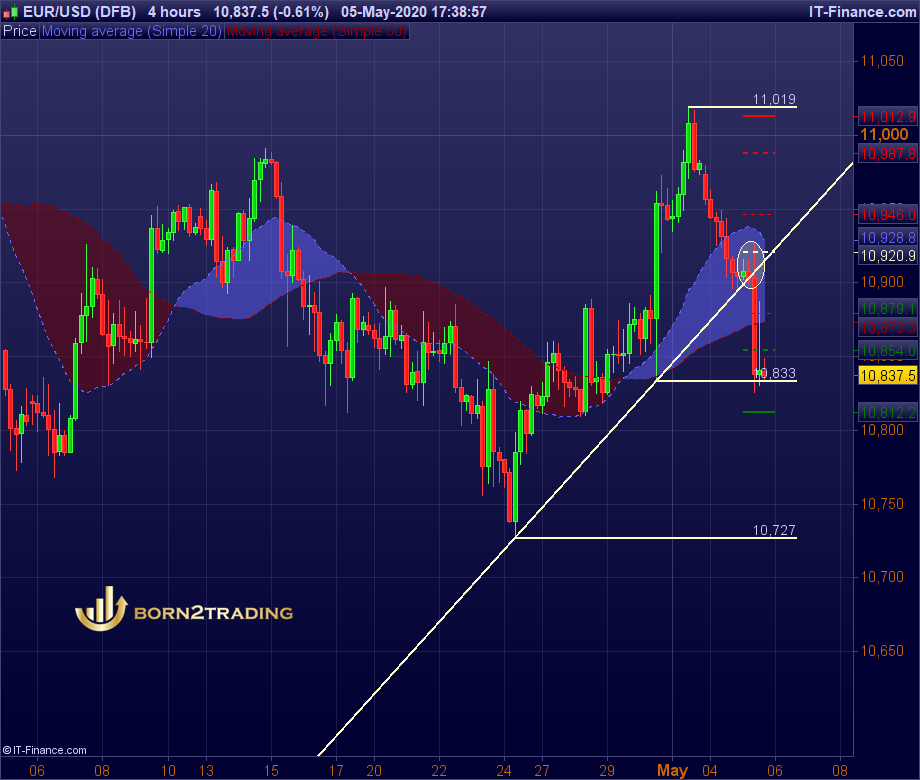
EUR/USD OUTLOOK
Daily Pivots: (S1)
10,879; (S2)10,854; (S3)10,812 (P)10,920; (R1)10,946; (R2)10,987; (R3)11,012
EUR/USD’s sharp fall today
and breach of 10,833 minor support suggest that rebound from 10,727 has
completed. Intraday bias is turned back to the downside for 10,727 first. The break will target 10,635 low next. On the upside, the break of the trend line above 10,920 will
turn bias to the upside for 11,019resistance. After all, the corrective pattern
from 10,635 low is still in progress.

US-China Tension
US-China tension continues to be a major theme today, driving global stocks and US futures down.
Developments are happening on many fronts. There will be proposed law changes to allow private entities to sue China for coronavirus damages.
Investment of federal retirement funds in Chinese stocks could be blocked.
President Donald Trump might revert to tariffs as punishments.
Also, it’s reported that the administration is turbo-charging the initiative to move the global supply chain out of China.
In the currency markets, the Canadian Dollar is currently the strongest one, followed by Yen and Dollar.
New Zealand Dollar is the weakest, followed by Sterling and Euro.
The common currency is somewhat weighed down by poor sentiment indicator.
Markets are trying to reverse April’s moves.
Yet, it might take more time to confirm if risk aversion is really back.
22941 support in DOW is a key near term level to defend, which DOW is still quite far above.
6,729 support in AUD/JPY is another level to watch.

April 2020 - Premium Trading Signals Report
Hello Traders.
Here is our Premium Trading Signals Report for April 2020.
We've made +2081 pips profit.
122 generated signals
22 not executed
23 closed with stop loss
77 closed with profit
46 pips average profit per trade
77% accuracy.
We thanks all clients for their trust and cooperation so far.
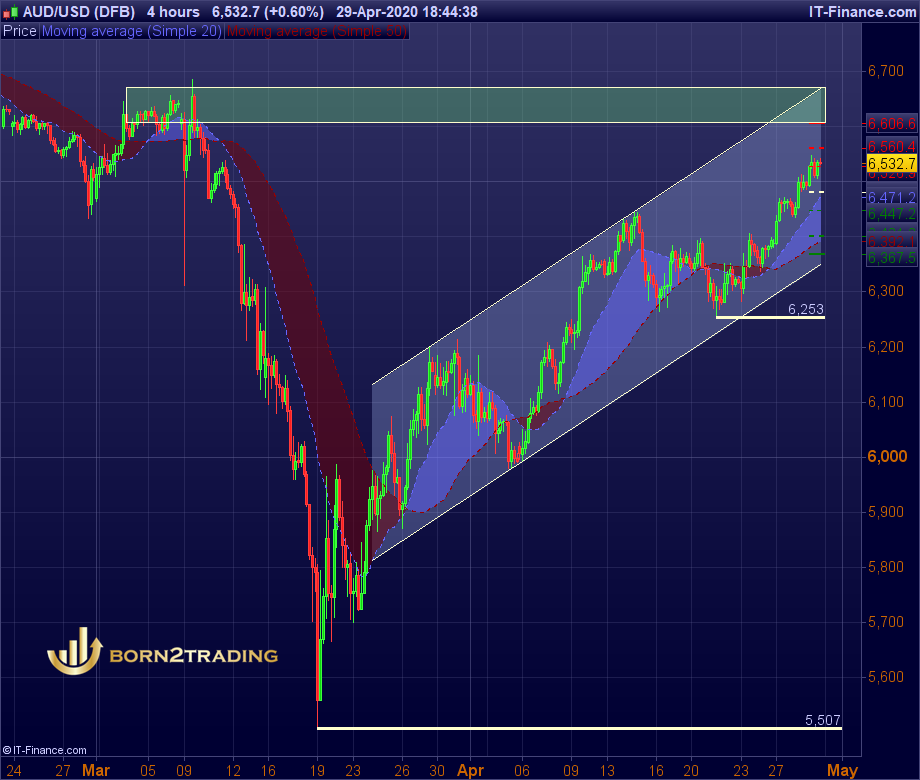
AUD/USD Daily Outlook
AUD/USD rise from 5,507 continues today and intraday bias
remains on the upside. Next target is 6,606-6,670 area between (R3) and top of
the channel band. Key resistance is 6,685 level high from beginning of March
2020. On the downside, price below 6,480 minor support will turn intraday bias
neutral first, but further break of 6,253 support will suggest medium term
trend changing.
www.born2trading.co.uk
Pay-Per-Trade - new product, simple top-up and go, just buy
selected Premium signals, no subscription required.
https://www.youtube.com/watch?v=RJRv-1e239Y
Telegram Channel:
https://t.me/born2tradingfree
#born2trading #paypertrade #forex #forexsignals #tradingsignals #tradingalerts
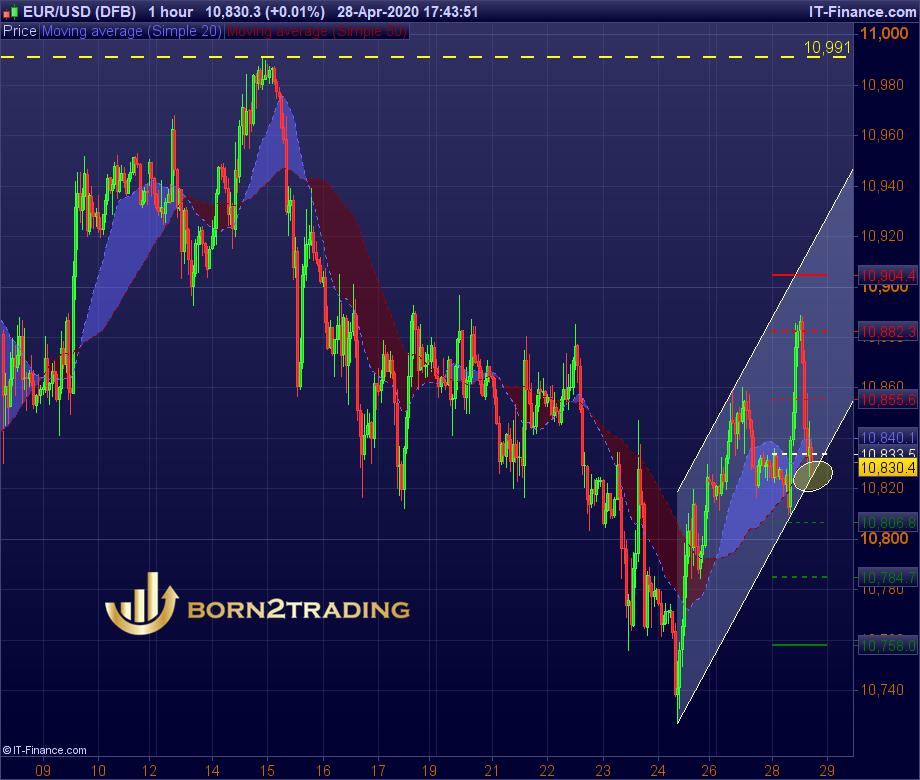
EUR/USD Mid-Day Outlook
Daily
Pivots: (S1) 10,806; (S2)10,784; (S3)10,758; (P)10,833; (R1)10,855; (R2)10,882;
(R3)10,904
After break today’s minor resistance on 10,882 we
would expect continuation uptrend till another minor resistance level at 10,991.
However just after today’s breakout 10,882 very strong price rejection just
pushed the price to the lower band of uptrend channel. Break there will
probably indicate test 10,784 with possible extension 10,727 level.
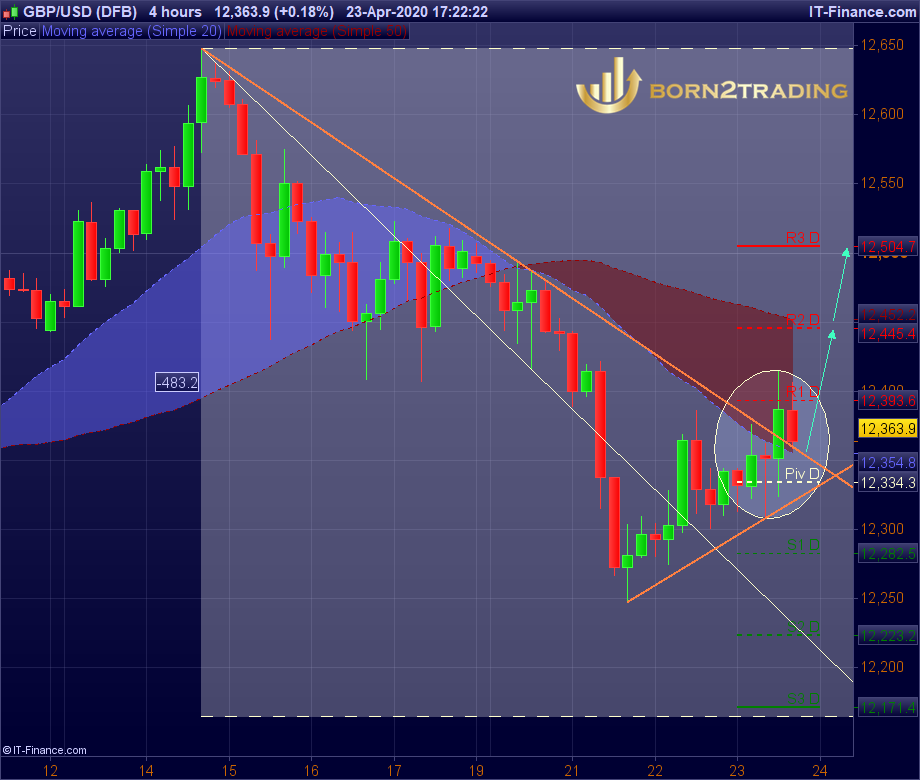
GBP/USD DAILY OUTLOOK
Daily Pivots: (S1)12,282; (S2)12,223; (S3)12,171; (P)12,334; (R1)12,393; (R2)12,445; (R3)12,504
Intraday bias in GBP/USD remains neutral as it’s still bounded in range of 12,165/12,647.
On the downside, a break of 12,165 will indicate completion of a rebound from 11,411.
Intraday bias will be turned back to the downside for retesting 11,411 low.
On the upside, a break of 12,647 will extend the rebound instead.
However today we see the clear break of downtrend formed from 12,650 level with a very strong test of (R1) level, which indicates very possible test (R2) and MA50 level around 12,445
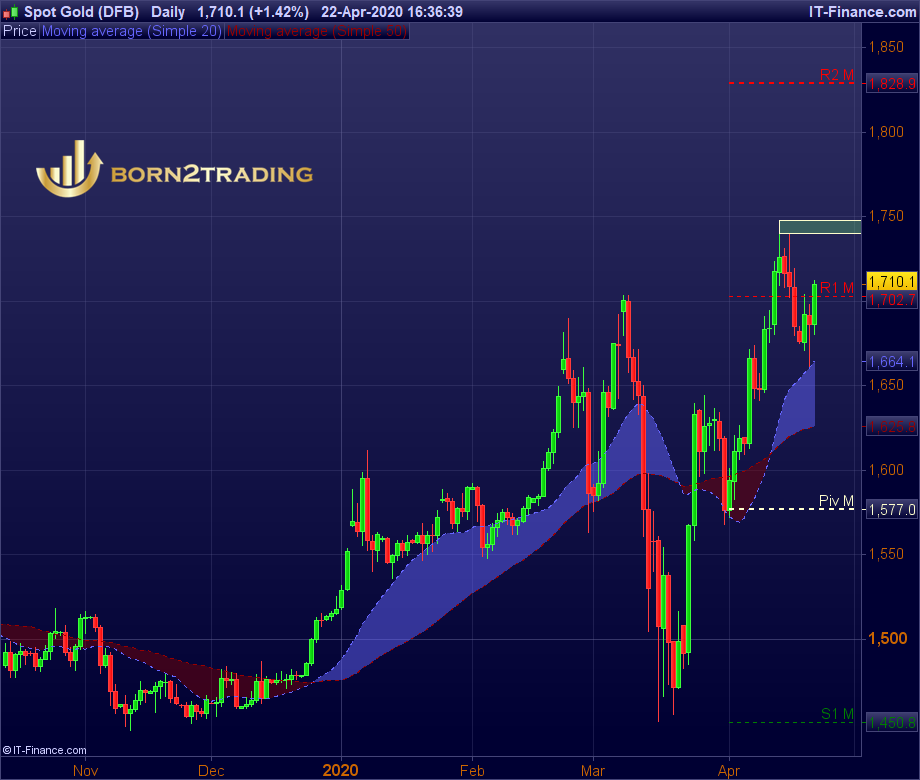
GOLD Daily Outlook
Yesterday,
Gold exchange rate touched the MA20 1,660.0 level. During Wednesday morning,
the rate was testing the resistance level—the monthly R1 at 1,702.7
Later on
monthly R1 was taken, if today closing price will hold above that level its
likely that XAU/USD probably will tested next resistance area 1,740.0-1,747.0
If this going
to happened price for gold could exceed the target and the way to monthly R2
1,828.9 will open.
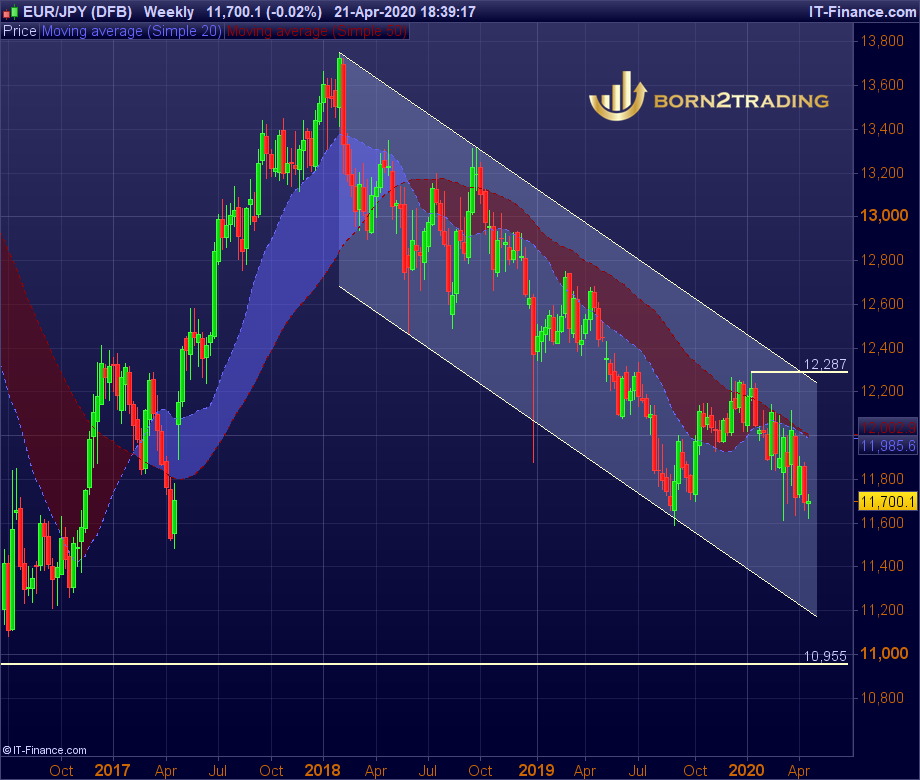
EUR/JPY Daily Outlook
EUR/JPY is now on a bit above 11,634/11,660 support zone.
Decisive break there will confirm larger down trend resumption. On the upside,
break of 11,795 minor resistance will turn intraday bias to the upside.
In the bigger picture, outlook remains bearish as
the cross is staying well inside falling channel established since 13,750 (Feb,
2018 high), as well as below falling MA50. As long as 12,287 resistance holds,
the down trend form 13,750 should extend to 10,955 (Jun, 2016 low). However,
sustained break of 12,287 will indicate medium term bullish reversal.
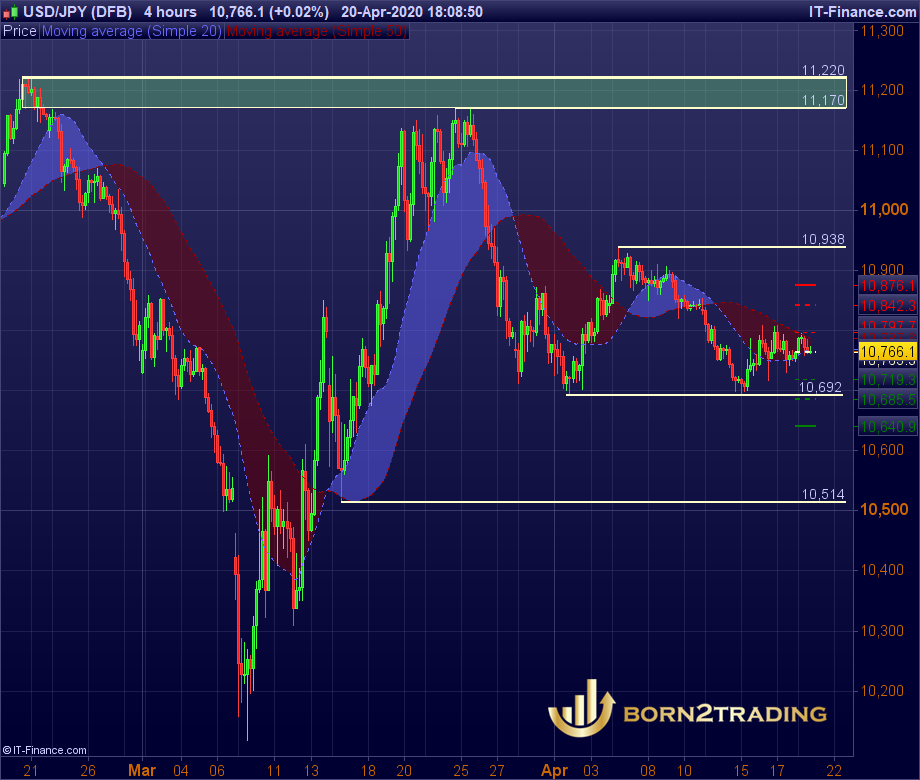
USD/JPY OUTLOOK 20/04/2020
USD/JPY OUTLOOK 20/04/2020
Daily Pivots: (S1) 10,719; (S2) 10,685; (S3) 10,640;
(P) 10,764; (R1) 10,797; (R2) 10,842; (R3) 10,876
Intraday bias in USD/JPY remains
neutral for the moment. On the downside, the break of 10,692 will most likely cause
the price drop to 10,514 closing the downward overbalance. On the upside, the break
of 10,938 will suggest that fall from 11,170 has completed. Intraday bias will
be turned back to the upside for 11,170/11,220 resistance zone.
Pay-Per-Trade - a new product, simple top-up and go, just buy
selected Premium signals, no subscription required.
https://www.youtube.com/watch?v=RJRv-1e239Y
Telegram Channel:
#born2trading #paypertrade #forex #forexsignals #tradingsignals #tradingalerts
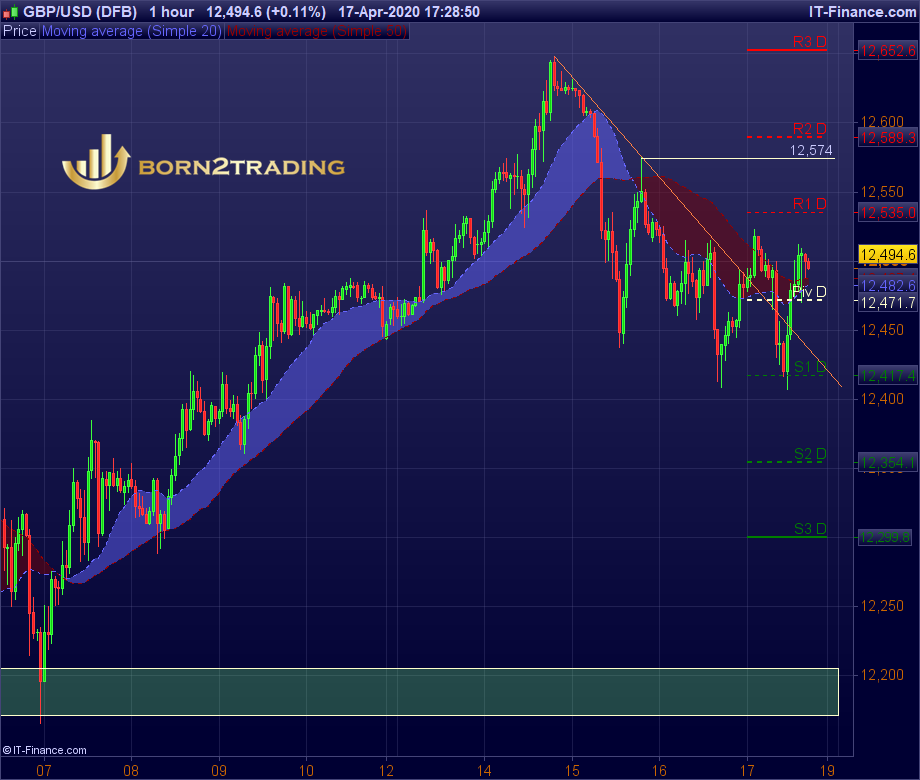
GBP/USD FRIDAY 17/04/20 OUTLOOK
GBP/USD FRIDAY 17/04/20 OUTLOOK
Daily Pivots: (S1) 12,417; (S2) 12,12,354; (S3)
12,299 (P) 12,471; (R1) 12,535; (R2) 12,589; (R3) 12,652
GBP/USD is staying in the range between 1 hour 50 MA
and 12,574 temporary top and intraday bias remains neutral first. Another rise
is mildly in favour as long as 12,471 Daily Pivot support holds. However, the break
of 12,471 support will indicate completion of the rebound and turn bias back to
the downside for retesting 12,200-12,170 area.
Pay-Per-Trade - new product, simple top-up and go, just buy
selected Premium signals, no subscription required.
https://www.youtube.com/watch?v=RJRv-1e239Y
Telegram Channel:
#born2trading #paypertrade #forex #forexsignals #tradingsignals #tradingalerts
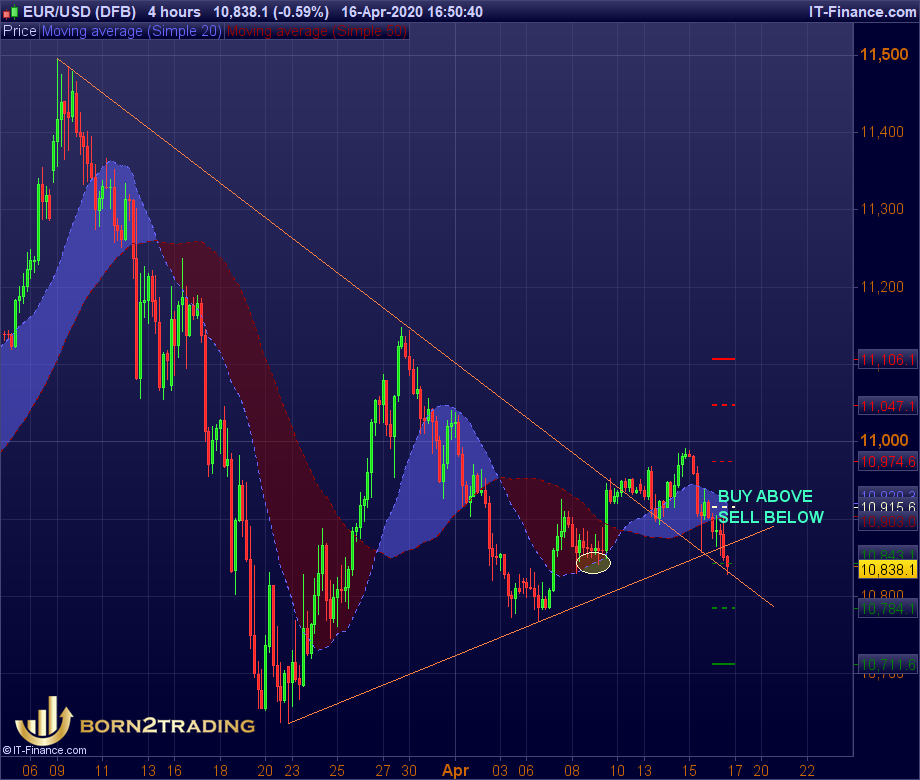
EUR/USD Technical Analysis
The Euro is starting to appear increasingly weak against the US dollar as the pair starts to settle below the 10,900-support level.
Technical analysis shows that a drop below the 10,850 level could cause EURUSD pair to decline towards the 10,800-support level.
Bulls need to break back above the 10,900-resistance level to start to encourage technical buying again.
The EURUSD pair is only bullish while trading above the 10,915 level, key resistance is found at the 10,980 and 11,050 level.
The EURUSD pair is only bearish while trading below the 10,915 level. Key support is found at the 10,840 and 10,780 levels.
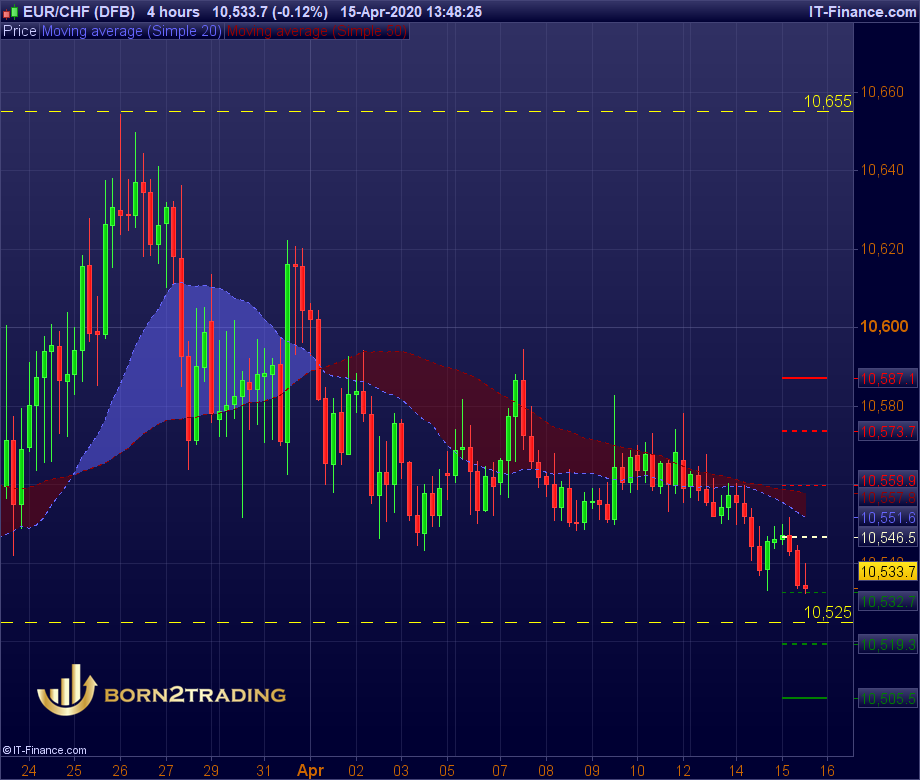
EUR/CHF Daily Outlook
EUR/CHF DAILY OUTLOOK
Daily Pivots: (S1) 10,532; (S2) 10,519 (S3) 10,505 (P) 10,546; (R1) 10,559 (R2) 10,573; (R3) 10,587
No change in EUR/CHF’s outlook as consolidation from 10,523 is extending.
Intraday bias stays neutral first. Another rise cannot be ruled out but upside outlook will remain bearish as long as 10,655 resistance holds.
On the downside, break of 10,525 will resume larger down trend to overbalance target at 10,394.
However, on the upside, break of 10,655 will indicate short term bottoming.
Stronger rebound would be seen back to 10,800 – 11,050 resistance zone.
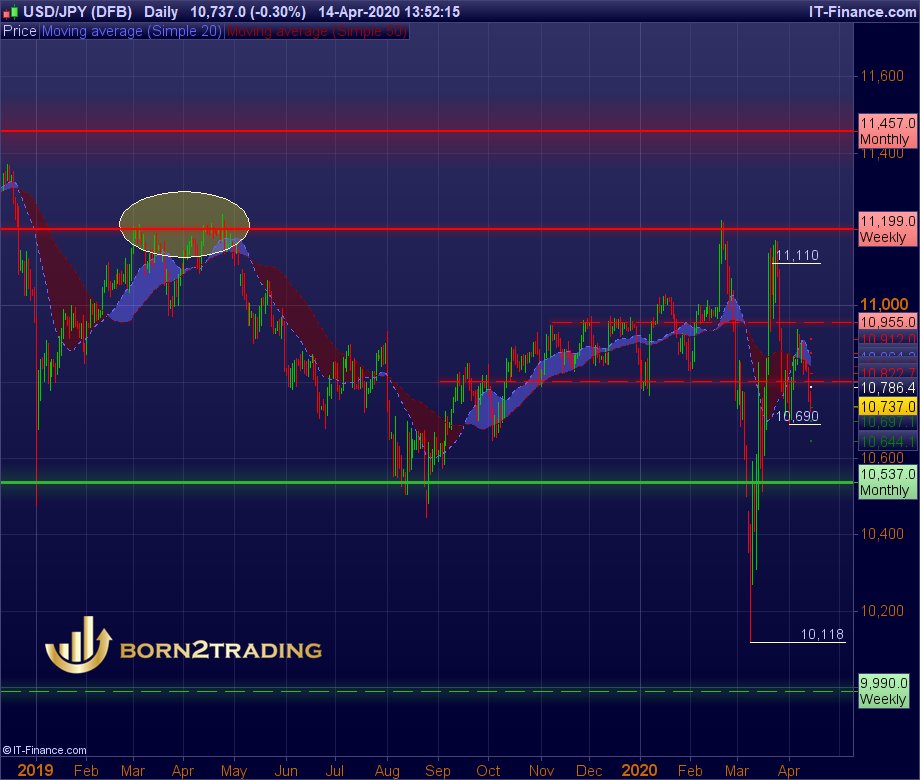
USD/JPY Outlook
USD/JPY DAILY OUTLOOK
Daily Pivots: (S1) 10,733; (S2) 10,10,697 (S3) 10,644 (P) 10,786; (R1) 10,822; (R2) 10,875; (R3) 10,912
Intraday bias in USD/JPY remains neutral for the moment as range trading continues.
On the upside, break of 10,955 will retain near term bullishness and turn bias to the upside for 11,110 – 11,200 resistance zone.
On the downside, decisive break of 10,530 support should confirm completion of rebound from 101.18, after failing 112.22 key resistance.
Intraday bias will be turned back to the downside for retesting 101.18 low.
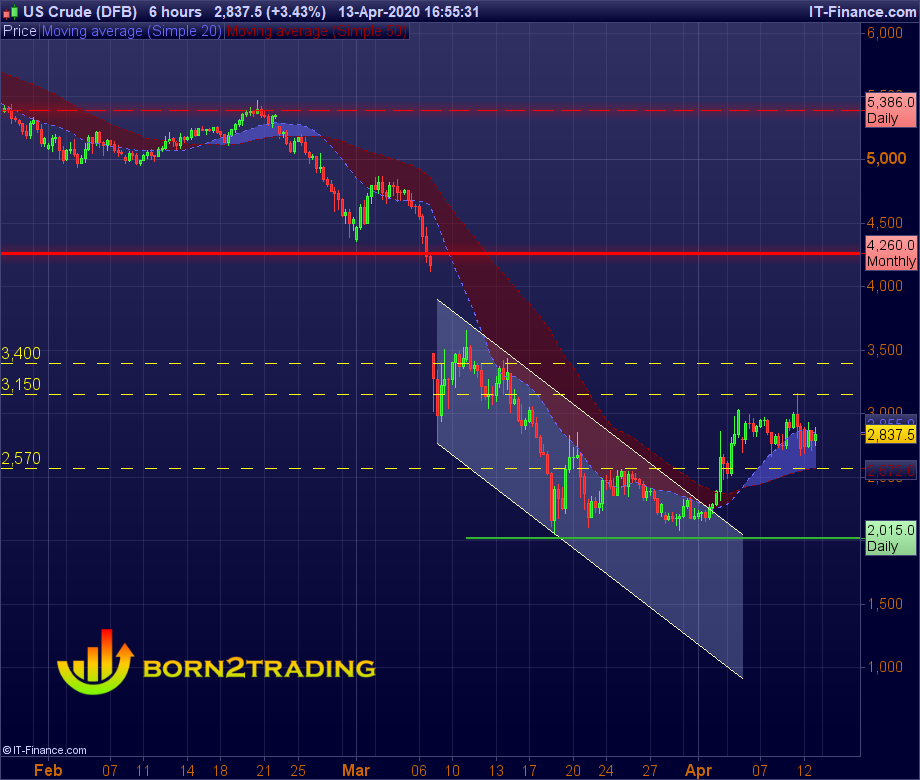
Oil Prices
Oil prices were pushing lower into Thursday’s close, but overall, price action was down just 0.02% on the day.
Another attempt to breakout above 2,800 was met with strong selling pressure. This put oil prices to retreat lower.
Further declines could see the 2,200 handle being tested once again with potential test on daily pivot 2,015 level But the current set up could be indicative of a possible rebound, as long as the 2,570 level holds.
Pay-Per-Trade - new product, simple top-up and go, just buy selected Premium signals , no subscription required.

March 2020 - Premium Trading Signals Report
Hello Traders.
Here is our Premium Trading Signals Report for March 2020.
We've made +3138 pips profit.
114 generated signals
16 not executed
25 closed with stop loss
73 closed with profit
79 pips average profit per trade
74% accuracy.
We thanks all clients for their trust and cooperation so far.

February 2020 - Premium Trading Signals Report
Hello Traders.
Here is our Premium Trading Signals Report for February 2020.
We've made +4381 pips profit.
120 generated trading signals.
27 not executed
30 closed with stop loss
63 closed with profit
70pips average profit per trade.
69% accuracy.
We thanks all our clients for their trust and cooperation so far.

January 2020 - Premium Trading Signals Report
Here is our Premium Trading Signals Report for January 2020.
We've made + 4189 pips profit.
121 generated trading alerts
32 were not executed (cancel)
21 closed with stop loss
68 closed with profit
Accuracy over 74%
We Thank all our clients for their trust and cooperation so far.
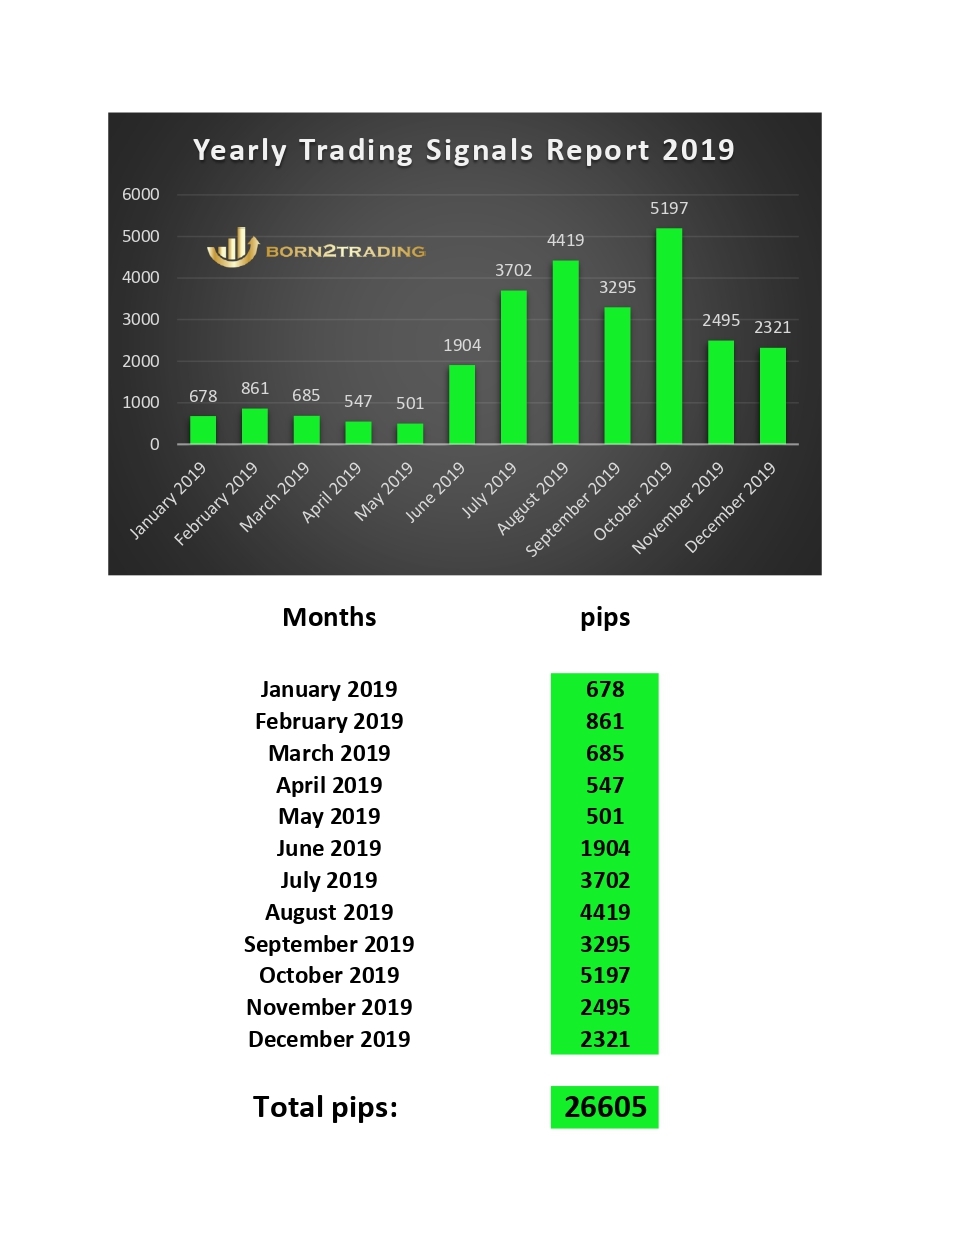
Yearly Trading Signals Report 2019
"Most People overestimate what they can do in one year and underestimate what they can do in 10 years"
We don't! Trading is hard, very hard, it's probably the one of the most challenging things. If you want to make $1 milion in the first year of trading you probably fail, even if you are smart and determined.
So, what you need to be a successful trader? First of all, you have to focus on not losing money, set the goal, adjust the timeline and educate yourself.
After 10 years from now you will be shocked how well is your trading.
Good new is that you can save most of the time and start trading better then ever have immediately.
We already finish whole 2019 year of providing trading signals for our customers and what we achieved you can see on our yearly report.
I think is remarkable.
Born2Trading team.
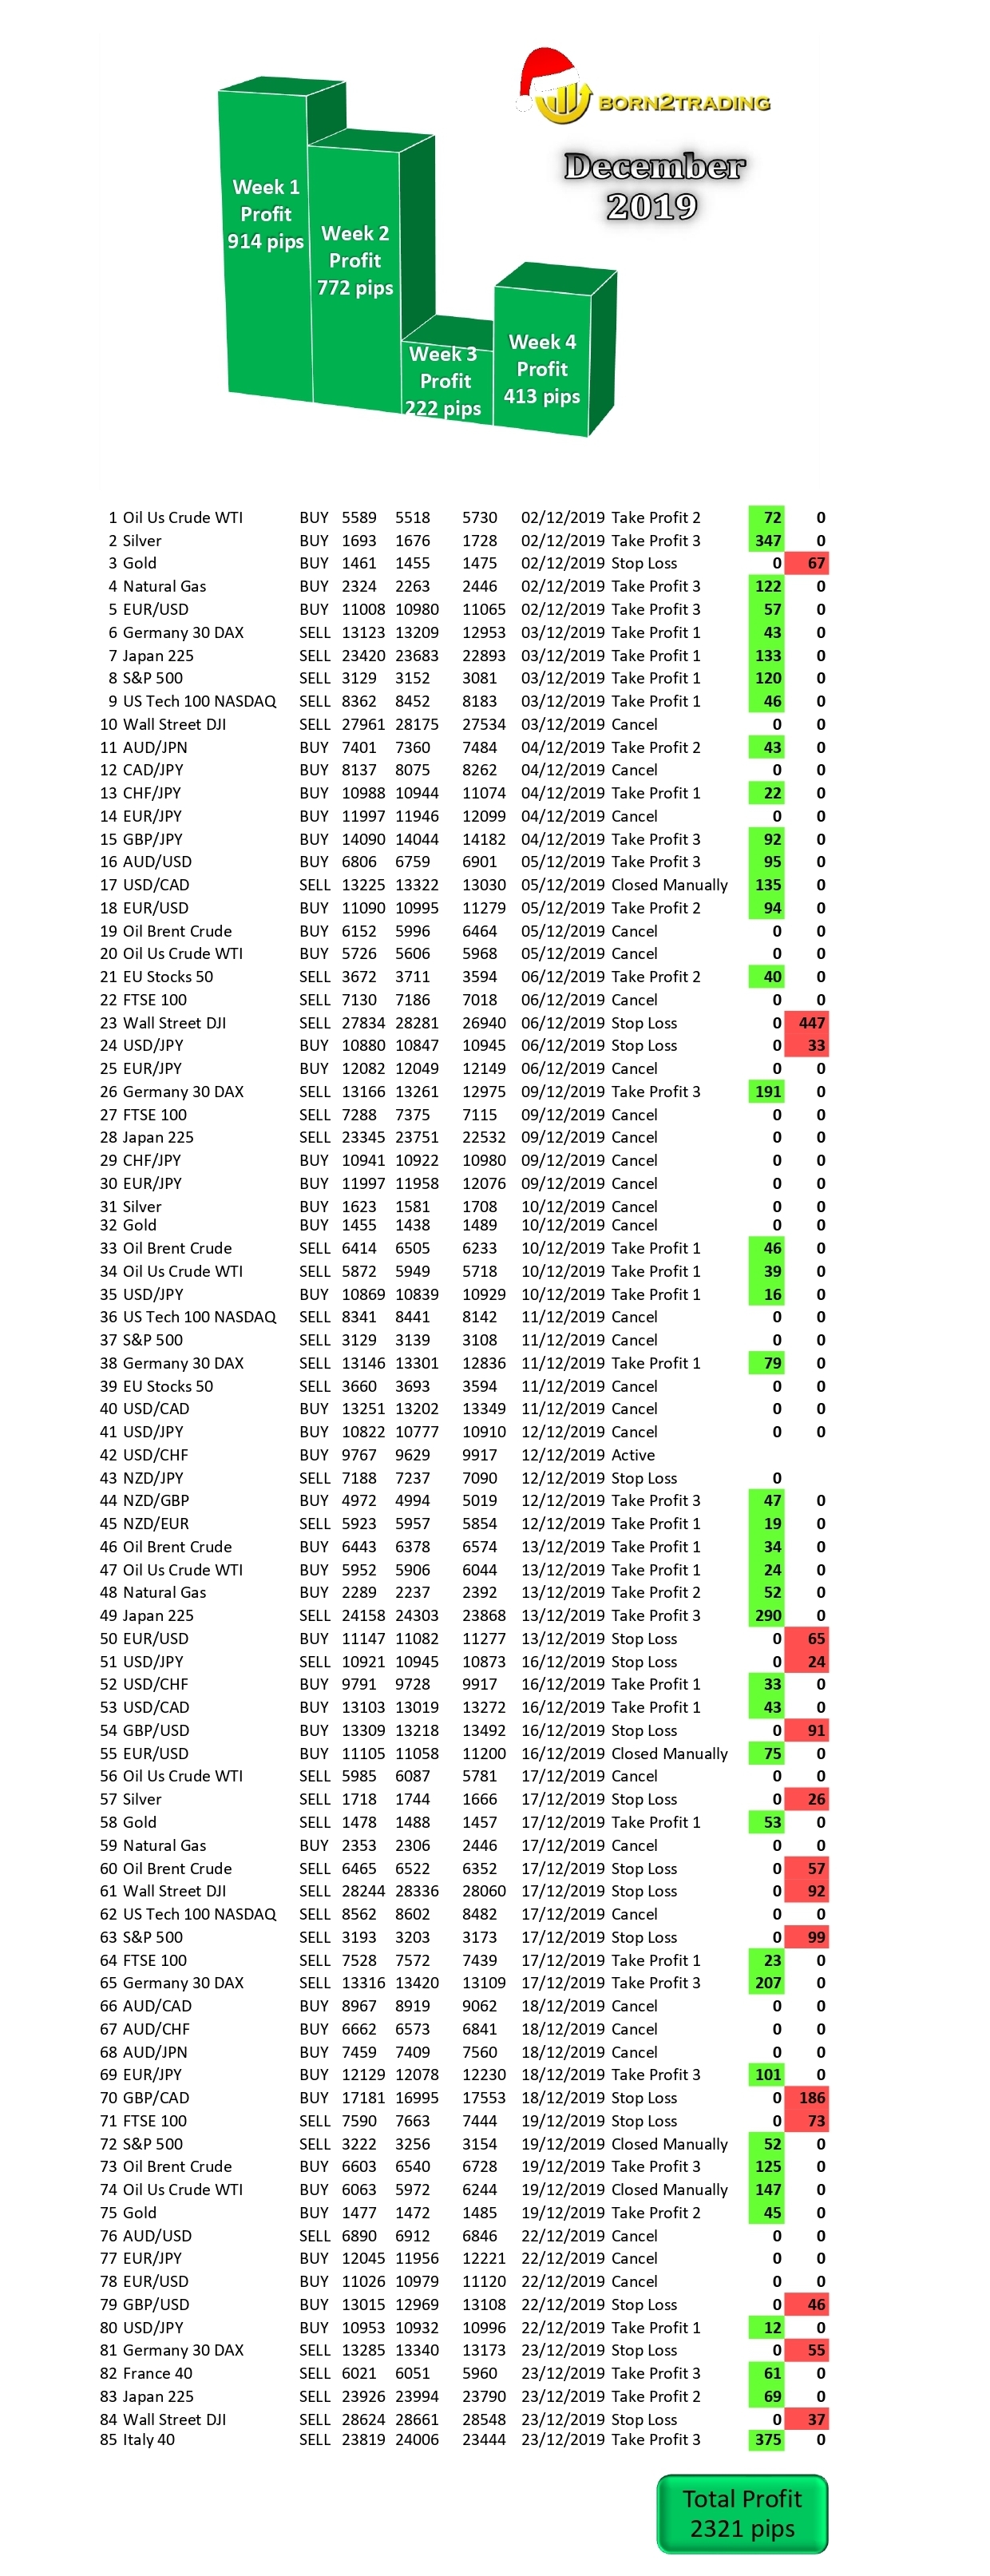
December 2019 Premium Trading Signals Report +2321 pips Profit
This is our December 2019 Trading signals report, with total gain +2321 pips, based on our Premium signals service.

Premium Trading signals November 2019 results
This is our November 2019 Trading signals report, based on our Premium signals service.
We thank all our clients for their trust and cooperation so far.
Our success depands on your success.
Born2Trading team.

Oil
The steady increase in oil prices has been rather predictable recently even if a bit uneventful. Oil seems to have been following the optimism that the US and China are finally moving towards a ‘phase-one’ trade deal that could put to rest concerns over global growth which has hindered any significant gain in prices due to a potential increase in demand. Traders will be watching closely to see if there are any further signs of progress between the world’s 2 largest economies. On the supply front, the usual oil inventory data will be important to watch for any fluctuations in storage levels and subsequently, contribute towards driving further price movements. US API and EIA inventories are released tomorrow and Wednesday.

Central banks monetary policy
Central banks monetary policy has given little reason for the EUR to recover against the mighty USD for the best part of 23 months. The struggling Eurozone economy and weak inflation have cause the ECB to maintain an extremely accommodative policy with ultralow interest rates and even the resumption of QE. Eurozone GDP figures hit the wires on Thursday morning which investors will show signs of improvement on recent data. Traders will be monitoring closely the Nonfarm Payroll figures release in the US on Friday afternoon as historically has been amongst the highest impact macro events on the calendar. Historically speaking, a higher than expected number could be viewed as positive for the native currency, whereas a weaker than expected figure could be viewed as bearish. With investors trying to second guess the next move from the ECB and the Federal Reserve, EURUSD could see exaggerated moves towards the end of the trading week.

Trading Premium Signals report October 2019
This is our October 2019 Trading signals report, based on our Premium signals service.
Massive profit +5197 pips , so far this is our record.
We thank all our clients for their trust and cooperation so far.
Our success depands on your success.
Born2Trading team.
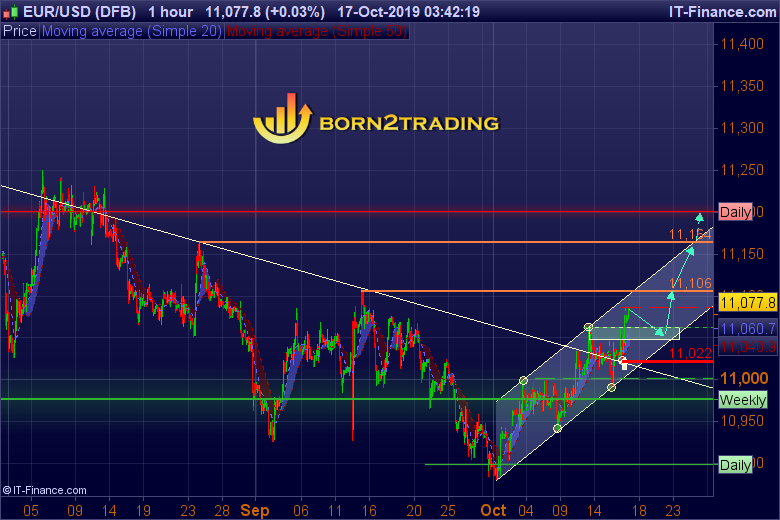
EUR/USD is above weekly major support level
Hi guys,
as you can see on chart EUR/USD is above weekly major support level and just hit the intermediate resistance at 11086. Since 1 October price moving up in well establish uptrend channel. So right now we looking for correction move to the green zone between 11063-11048 where we'll be try to find opportunity to get in long position with stop loss below 11022 and firs target around 11106, second target around 11164 with potential move extension up to daily major resistance at around 11200. Happy Trading
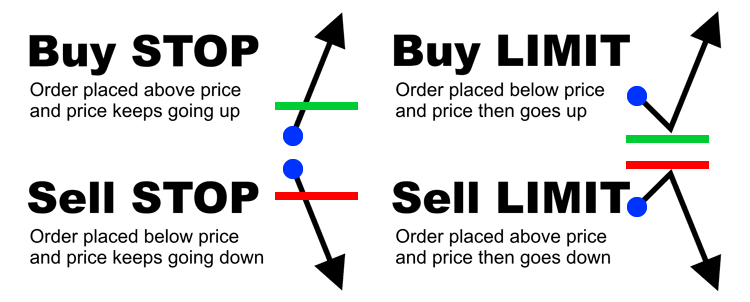
Stop & Limit orders
For those who still has a problem with the pending orders. Here is the graph , save it , remembered it.

US Crude
Hi guys,
I just wanted to share with you all, my point of view on the US Crude. I think we have a classic distribution pattern on the chart right now. After the biggest intraday move in history three weeks ago, since then, we have had constantly selloff on US Crude. Last Thursday we marked up to $51 level and what I see on the chart, is that long positions accumulate have just started. Only one piece is missing. Before the price will go up, according to distribution theory, the price should be testing again the previous low. As you can see we are just expecting to get in the long position at 5028 with a stop just below 4800, our target is nearly 5500.
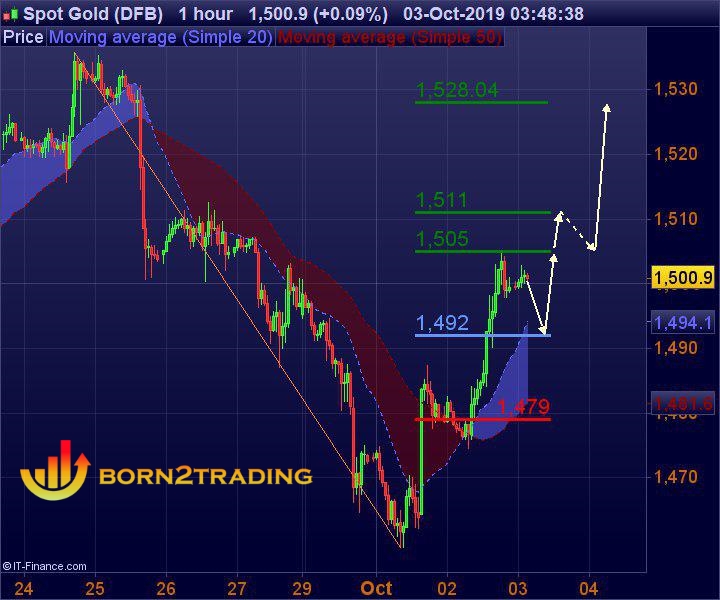
Gold
This is our prediction for a gold for the next few days. We expected pull back to 1492 level when we set buy limit order with stop loss at 1479.
Our target is divided into three levels. First target at 1505, second at 1511 and the last one at 1528 level.
Alternative scenario, buy stop above 1505 with the same profit targets levels.

Trading Premium Signals report September 2019
This is our report for the September 2019, based on our Premium signals service.
We thank all our clients for their trust and cooperation so far.
Our success depands on your success.
Born2Trading team

Trading Premium Signals report August 2019
This is our Premium Trading signals report for August 2019.
We thank all our clients for their trust and cooperative so far.
Our success depands on your success.
Born2Trading.

Trading Premium Signals report July 2019
This is our Premium Trading signals report for July 2019.
We thank all our clients for their trust and cooperative so far.
Our success depands on your success.
Born2Trading
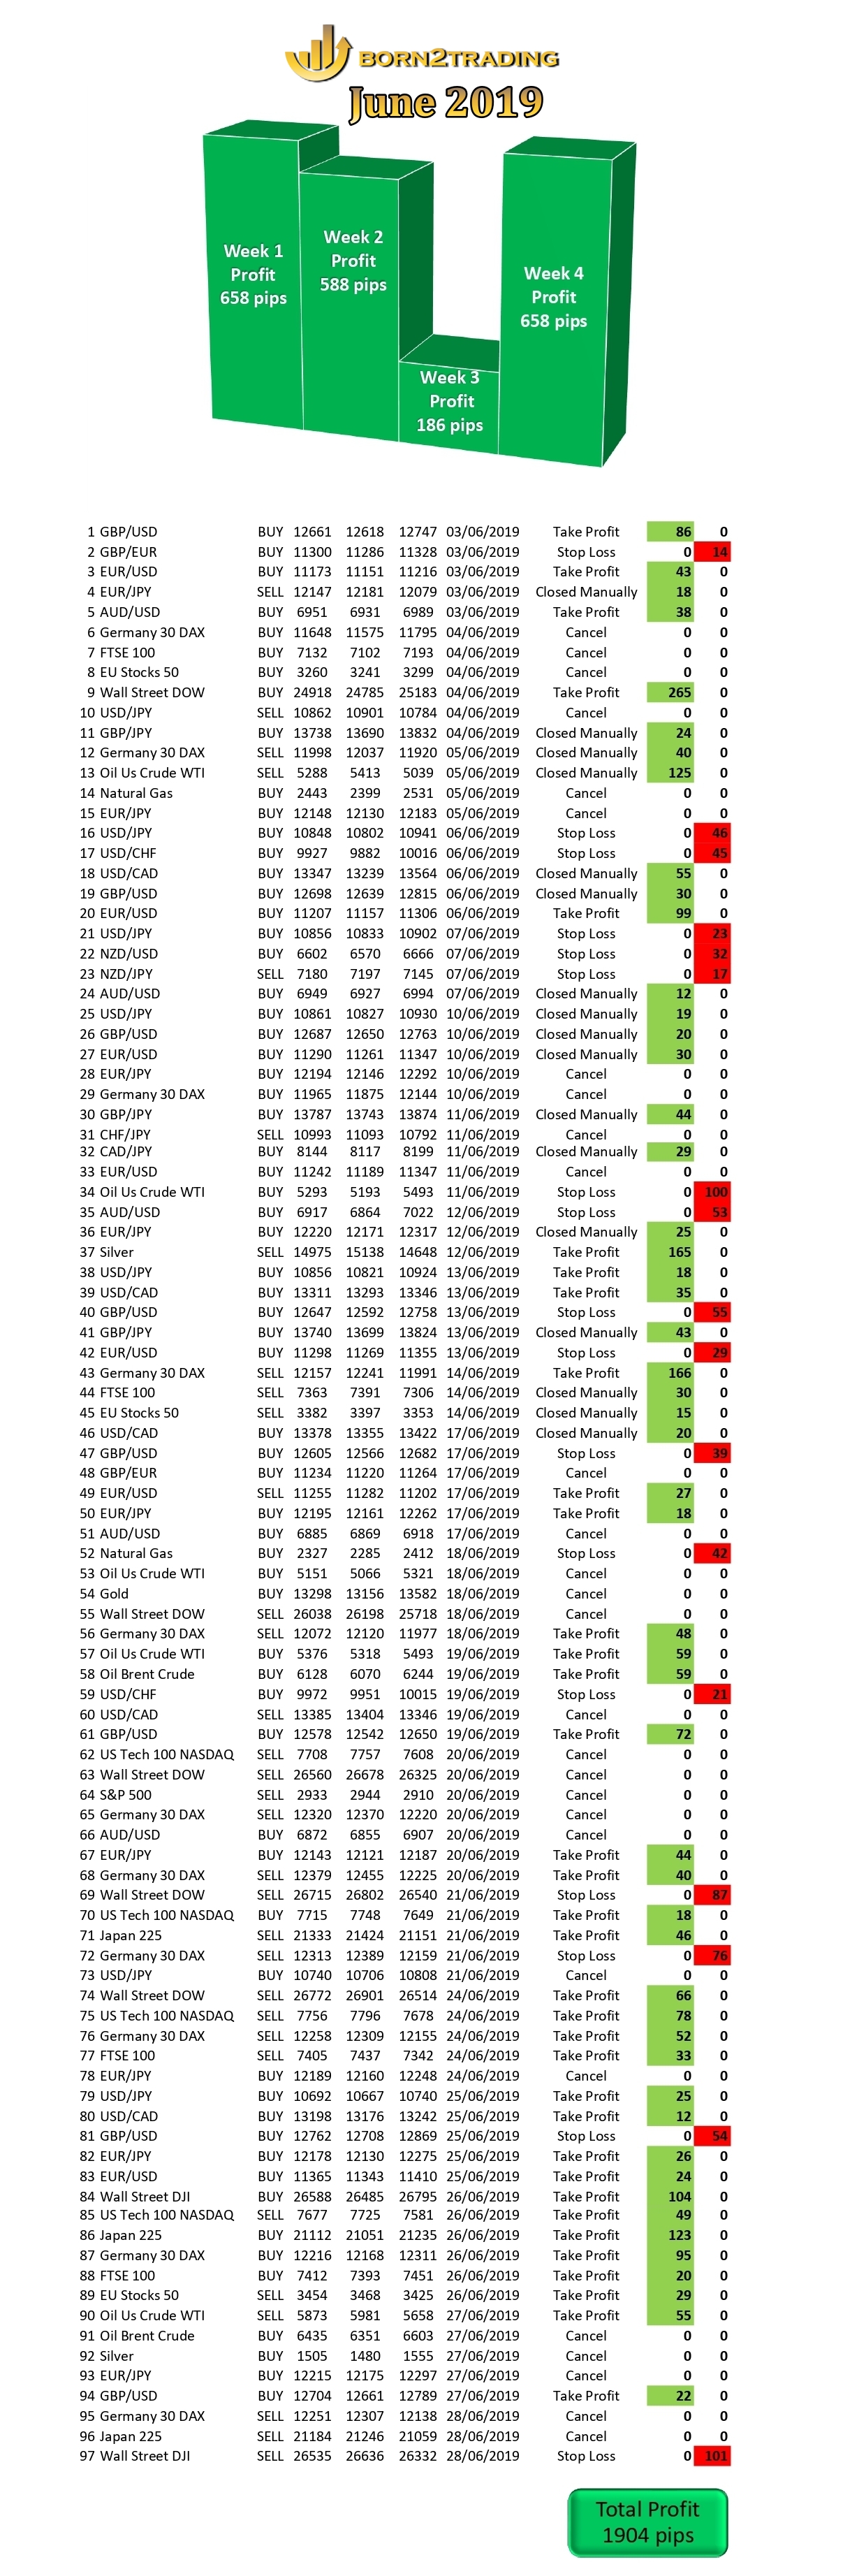
Trading Signals Report June 2019
This is our report for June 2019, based on our trading signals service.
We thank all our clients for their trust and cooperative so far.
Our success depands on your success.
Born2Trading
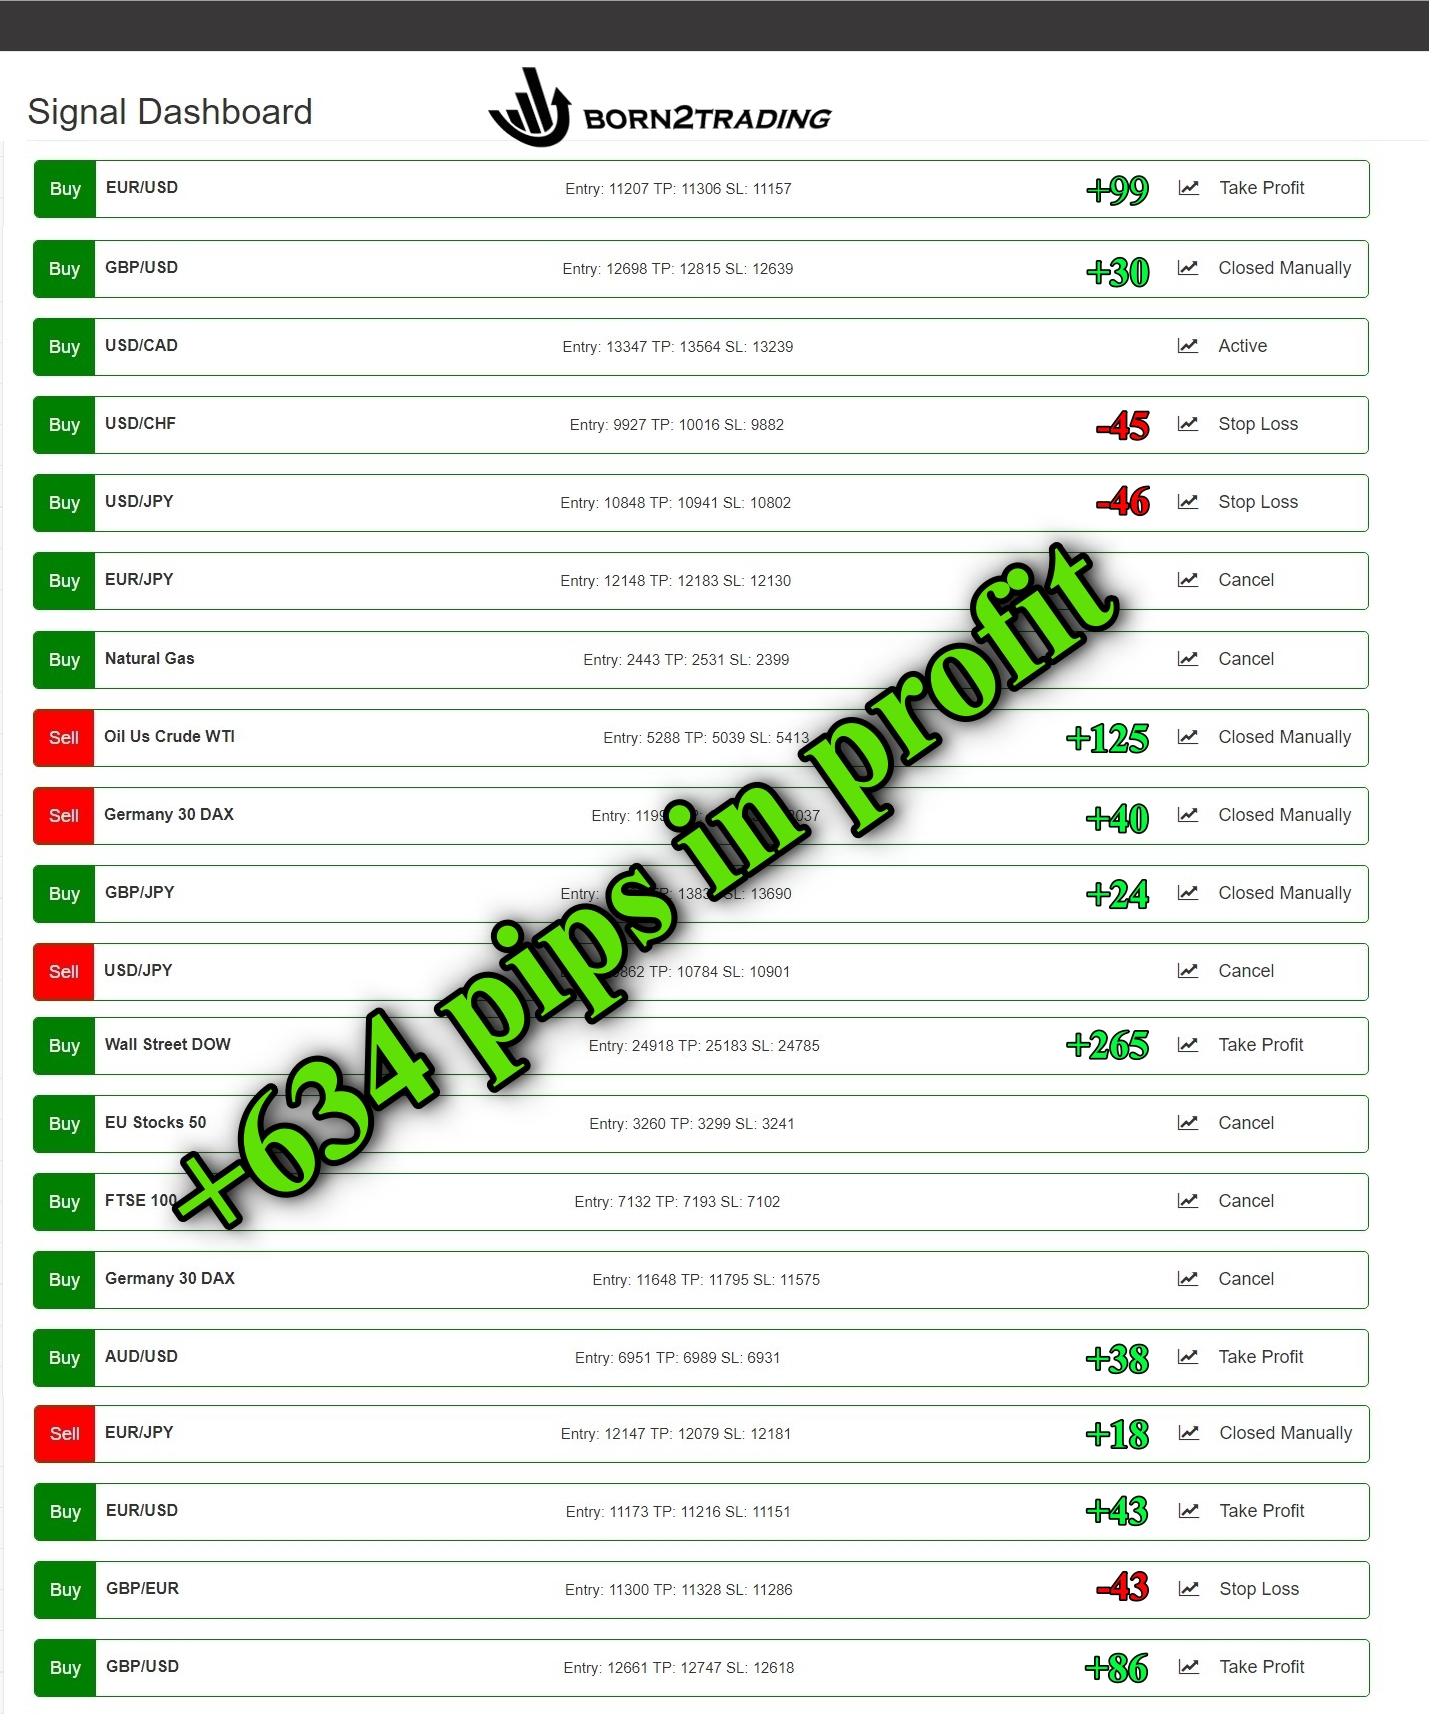
Premium Signals summary 1st week of June 2019
This is summary of our Premium Signals in 1st week of June 2019. +768 pips and only 3 stop loss -134.
Total in Profit +634.
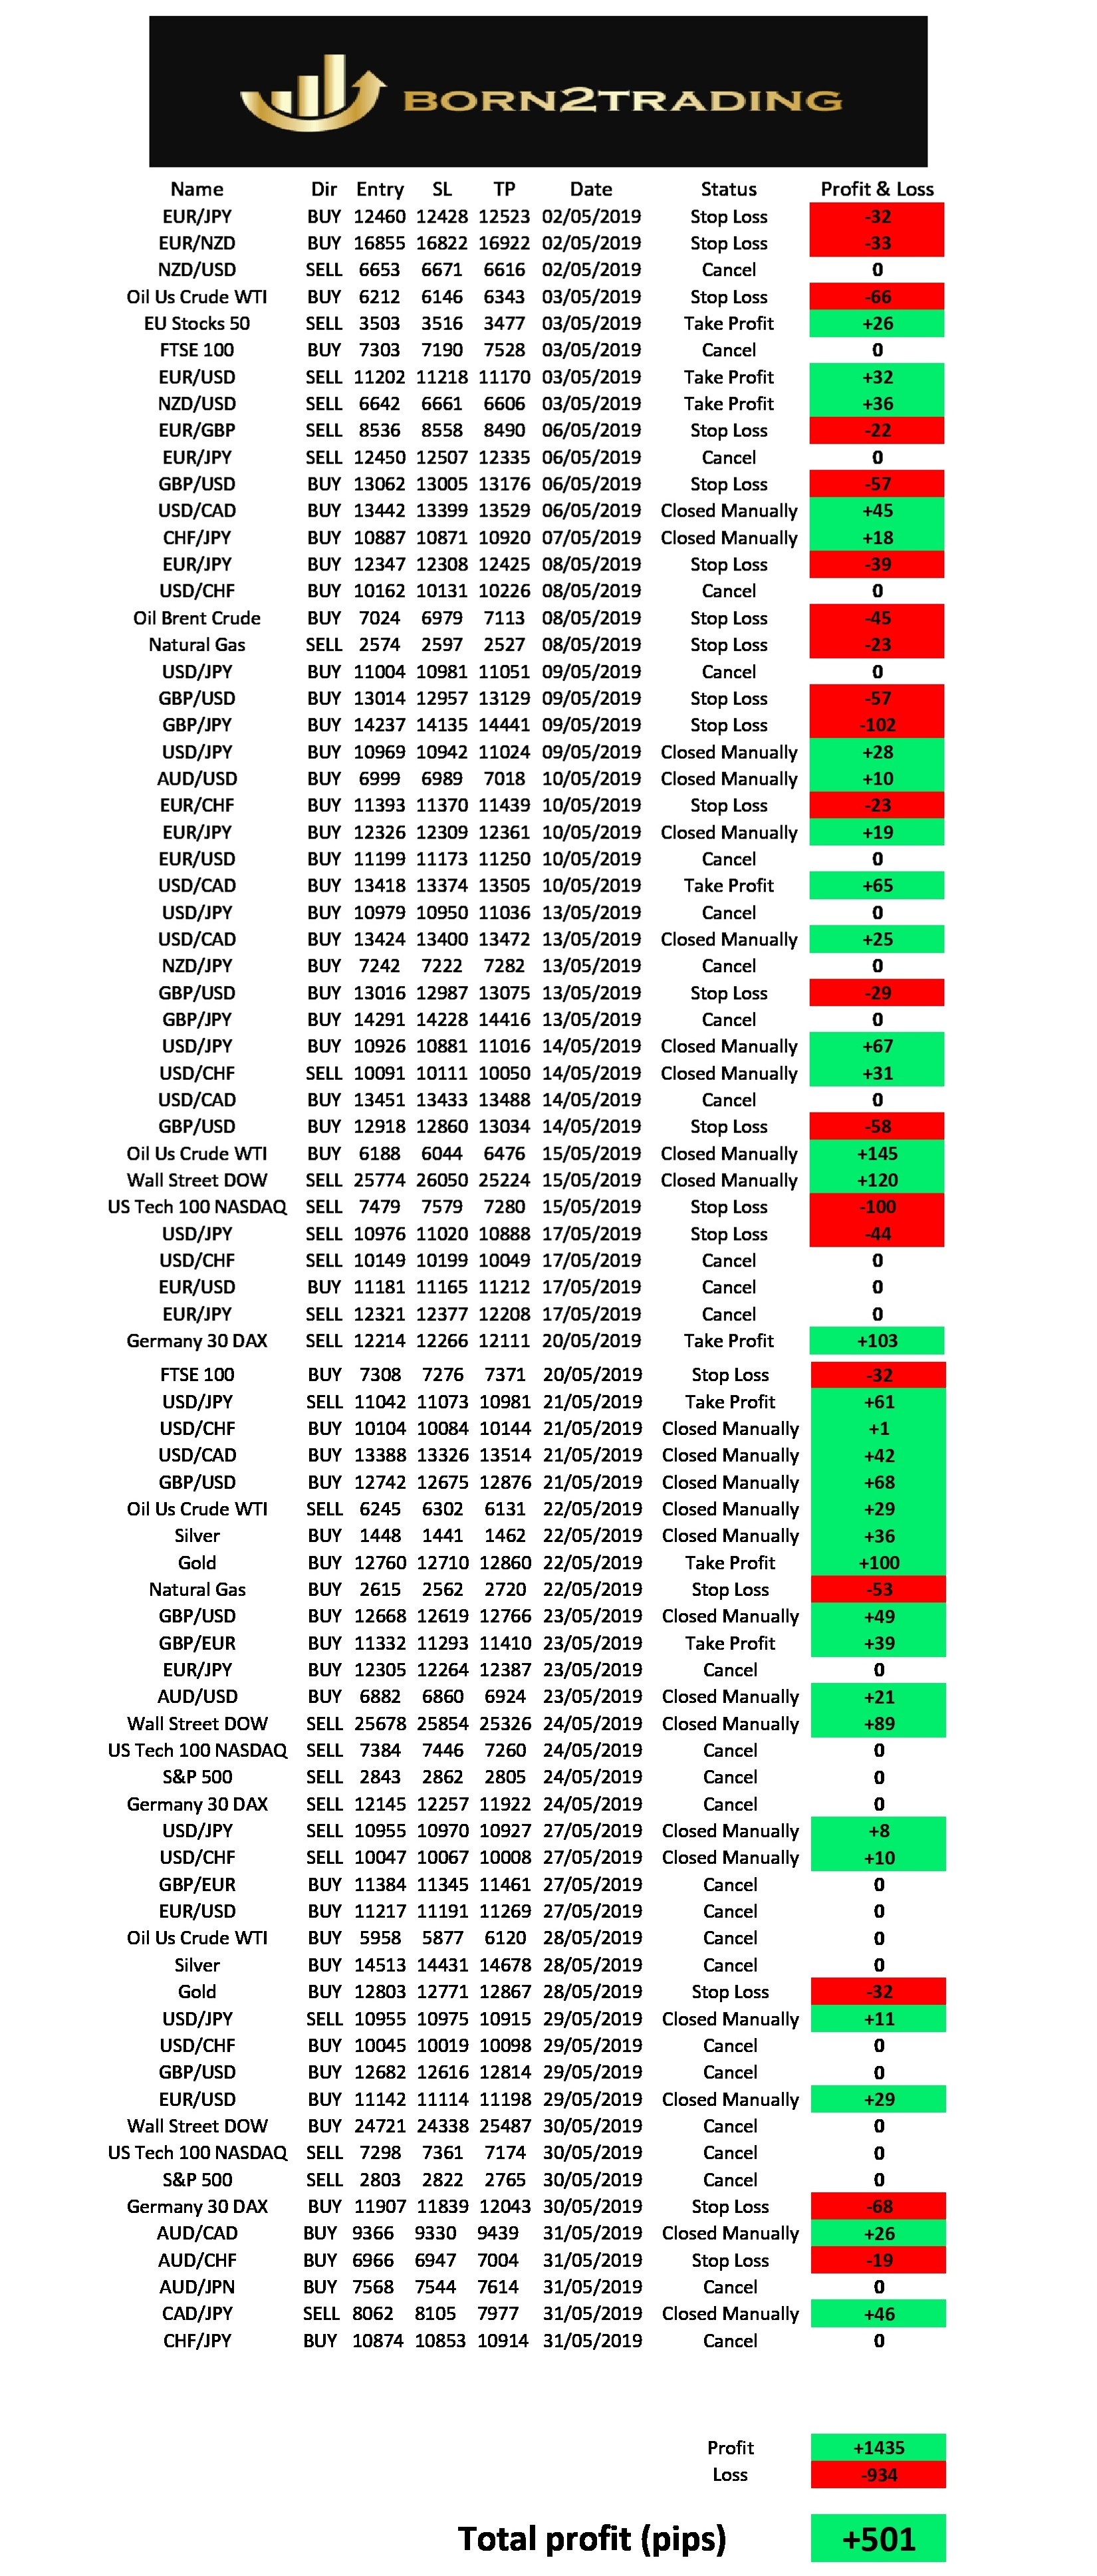
Trading Signals Report May 2019
This is our report for May 2019, based on our trading signals service.
We thank all our clients for their trust and cooperation so far.
Our success depands on your success.
born2trading
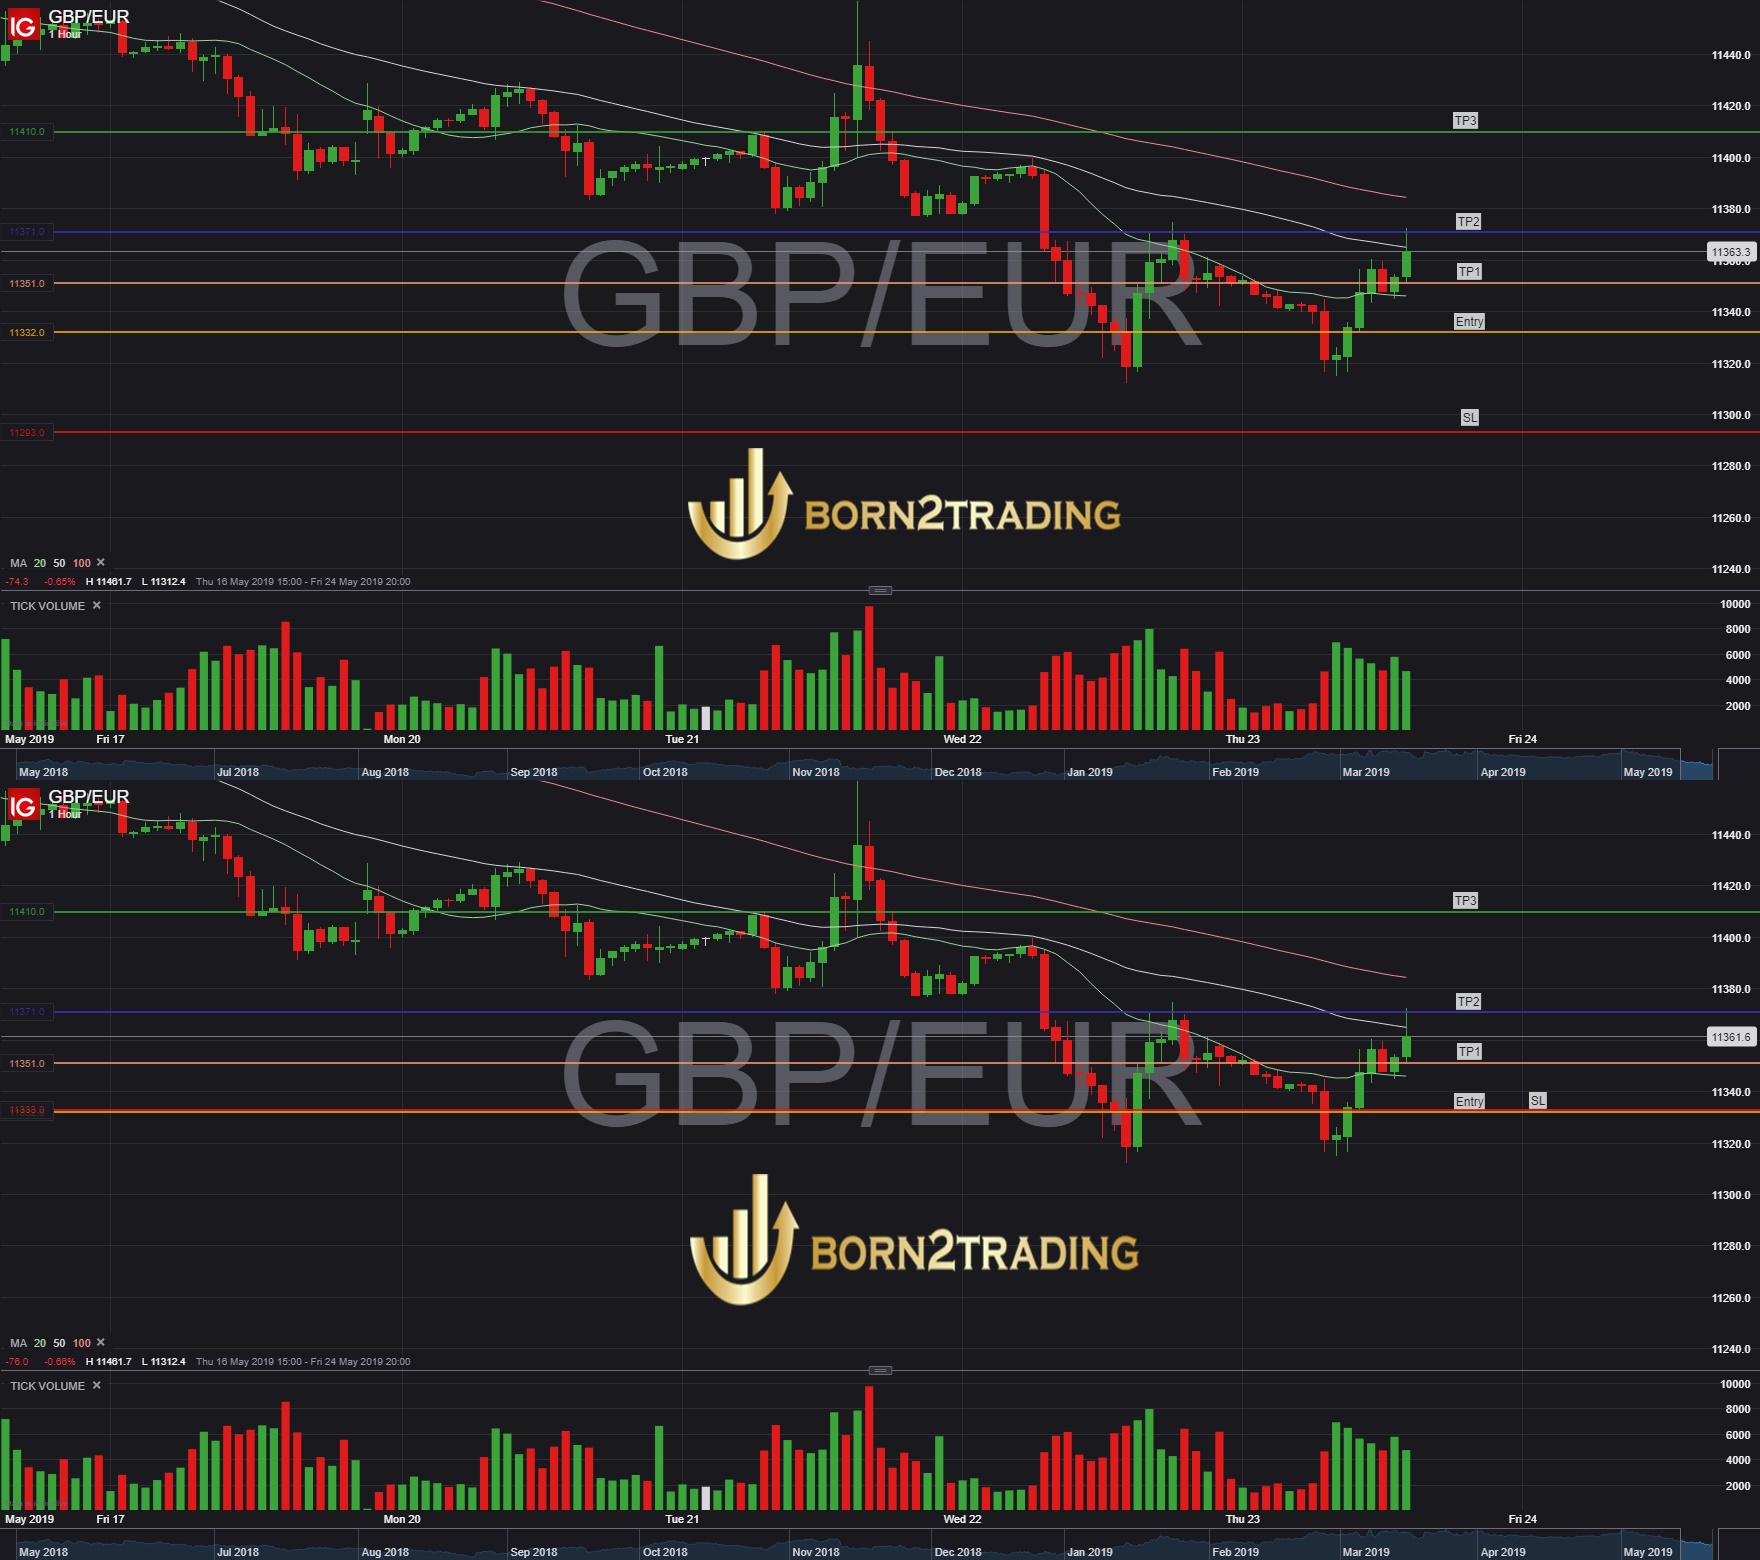
How to secure profitable trade
Hi.
This is example from our Premium signals , how to secure profitable trade.
When trade hit TP1 , we always recommend to our client to move stop loss to the entry point +1 pips ( that called Breakeven or just BE ).
Happy Trading.
50k Challenge
£50k challenge is oficial over ??As you know in May last year I started trading with £50k live account.
I finished this year with total gain over £31k what is over 62% return. What is more important drawdown was never extended than 10%!
Over 700 trades with accuracy over 80% .
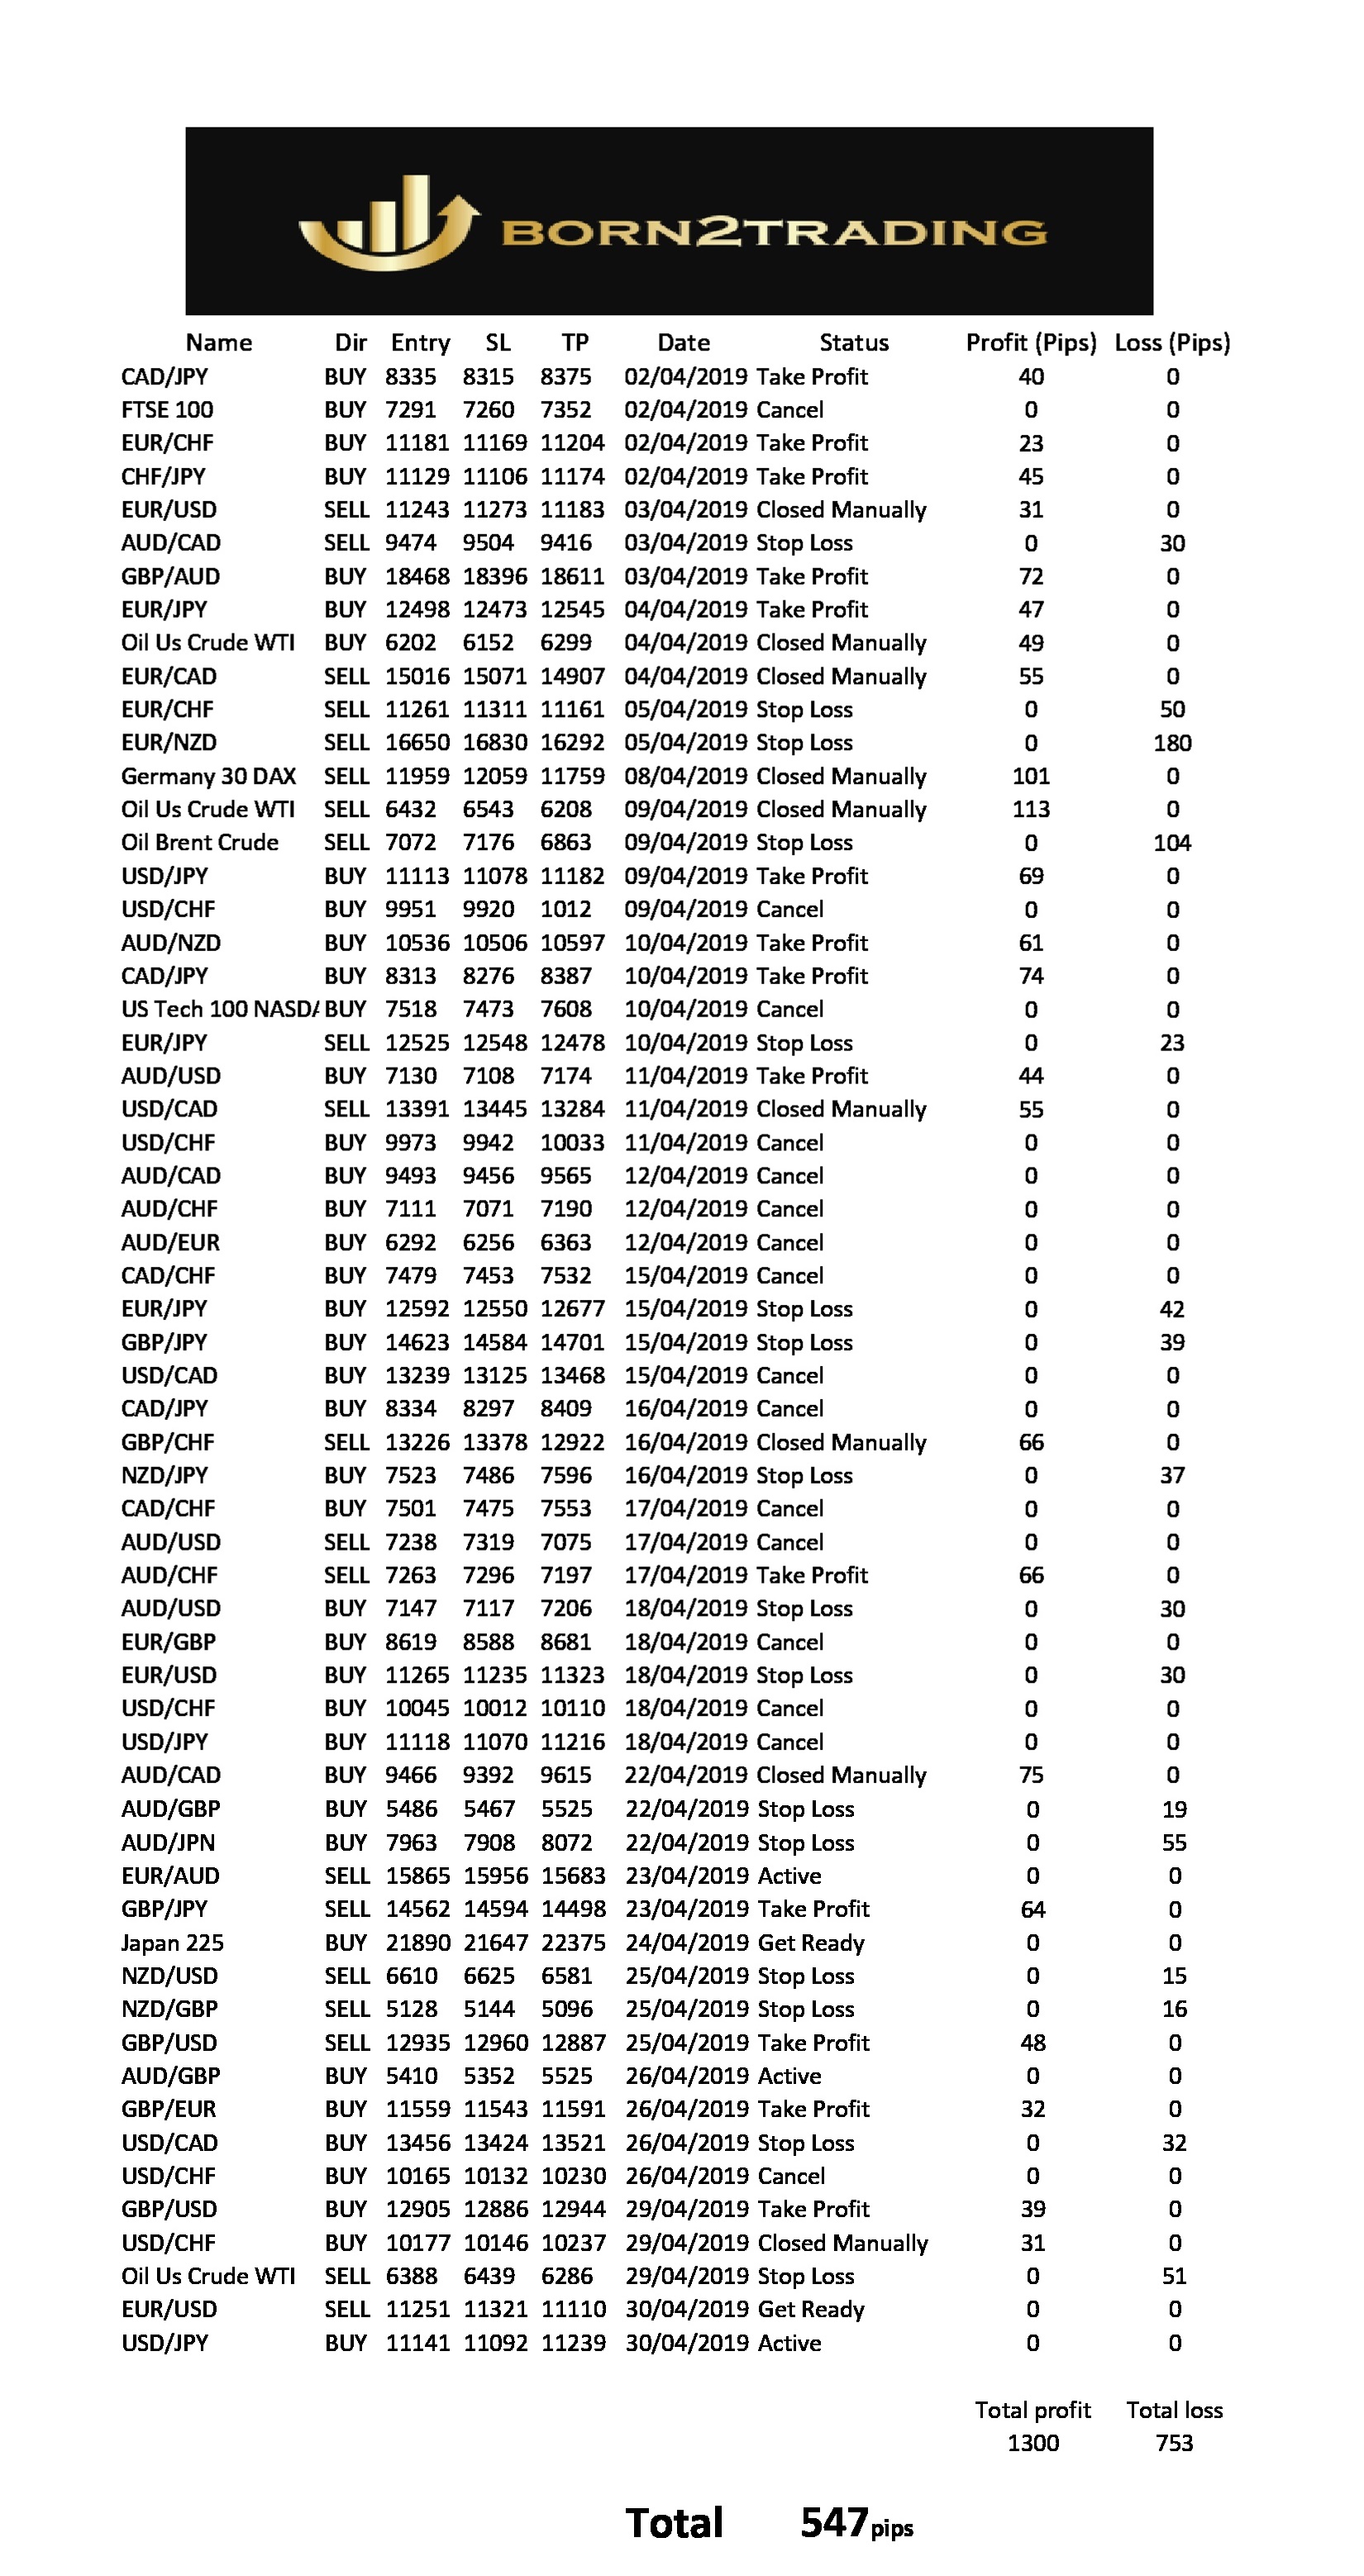
Trading Signals Report April 2019
This is our trading report for April 2019 , based on our trading signals service.
We thank all our clients for their trust and cooperation so far.
Our success depands on your sucess!.
born2trading

It is time for gold?
It is time for gold? As you can see on the charts, that buy point could come at any time between the current price and the possible drop to 1260-55 region. From that point, the most important is 1300 level, because the rally over 1300 should elicit a breakout over 1350. If it happens and we clear this area it will trigger a big picture and my expectation is that such a breakout will project to a minimum 1450 possible even 1550.
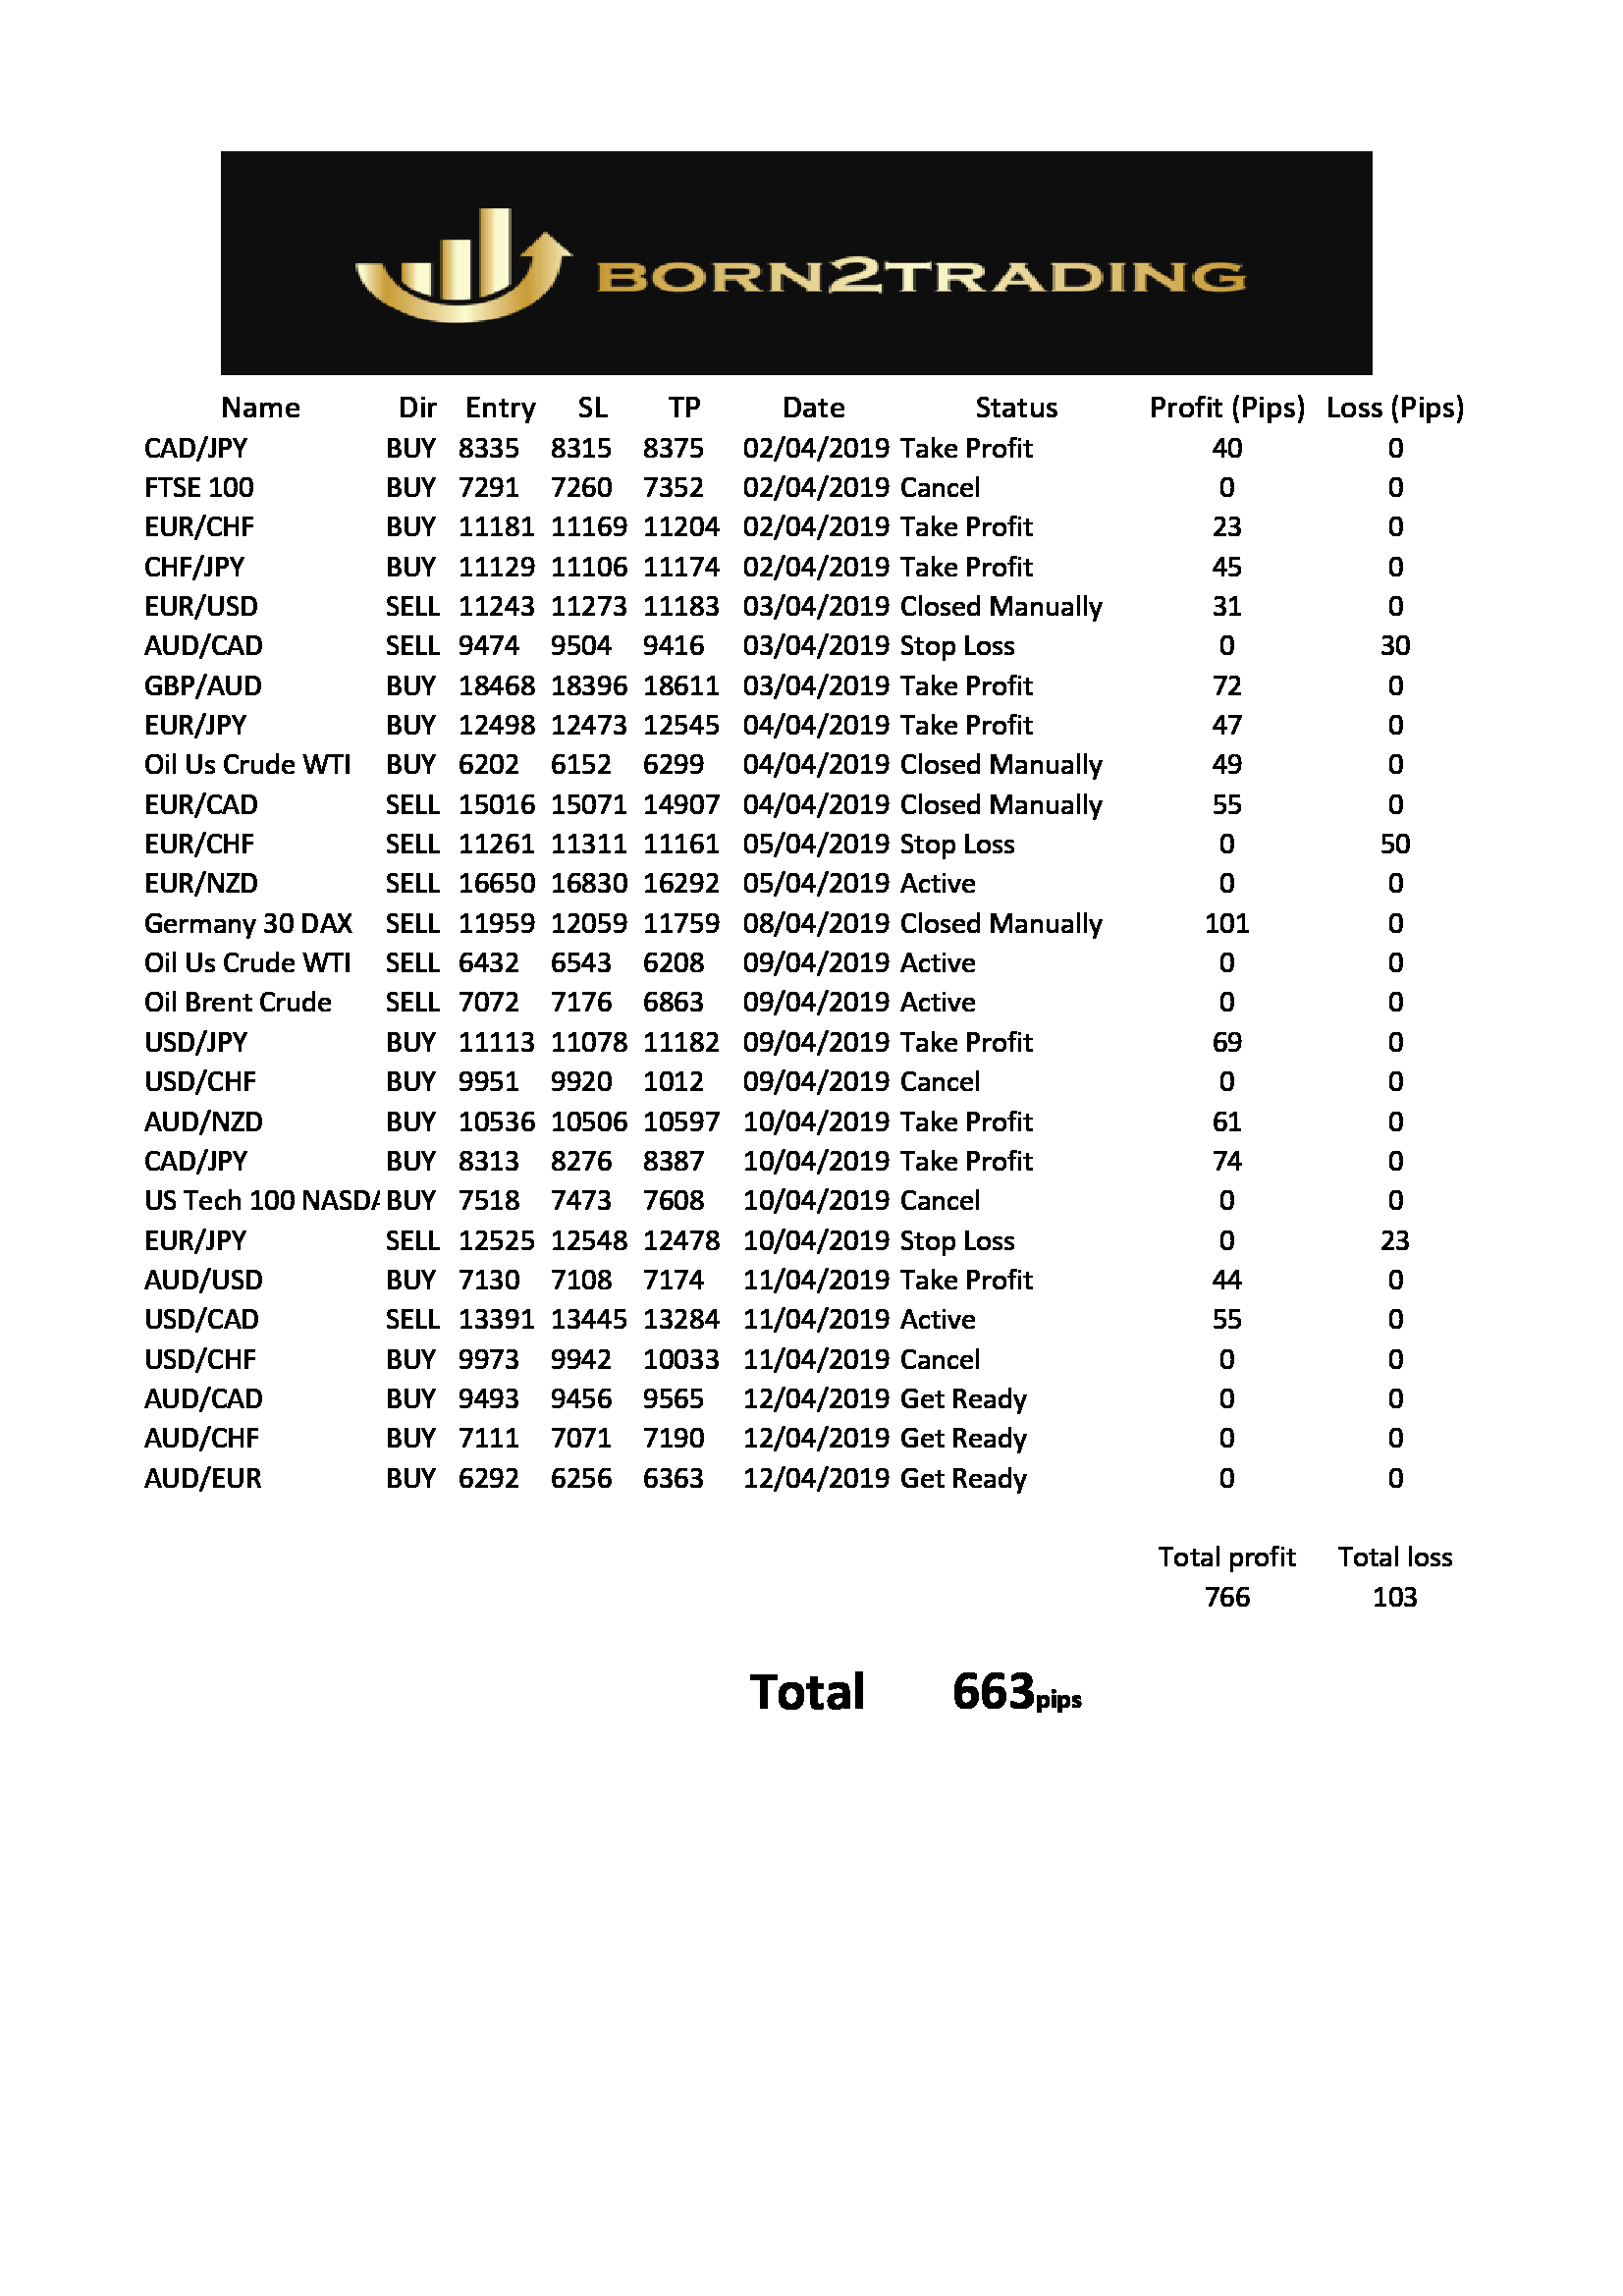
Trading Signals Report - First 2 weeks of April 2019
Here is our report for first 2 weeks of April 2019,based on our trading alerts service.
Very good resoult of 663 pips profit.
We thanks all our clients for their trust and cooperation so far.
Our success depands on your success!.
Born2Trading.
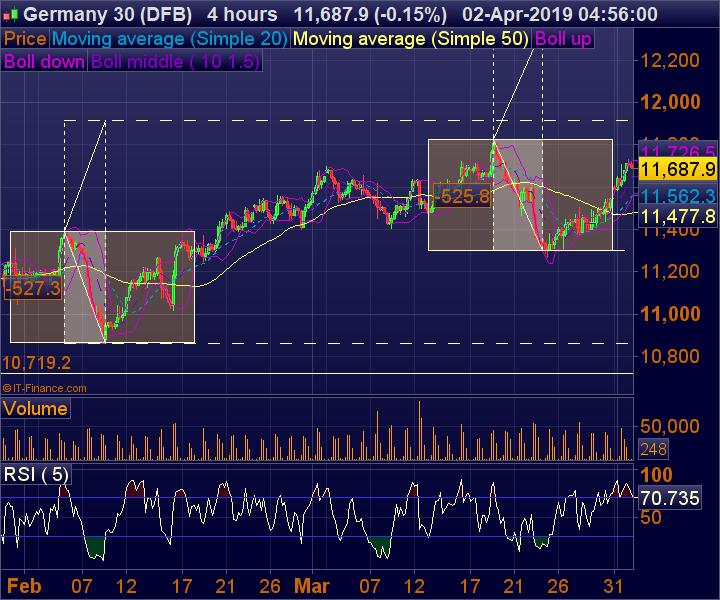
Trading techniques over balance
One of our favourite trading techniques is counting over balance. It’s hard to believe when you see the target for over 500 pips with risk just... 30 pips.
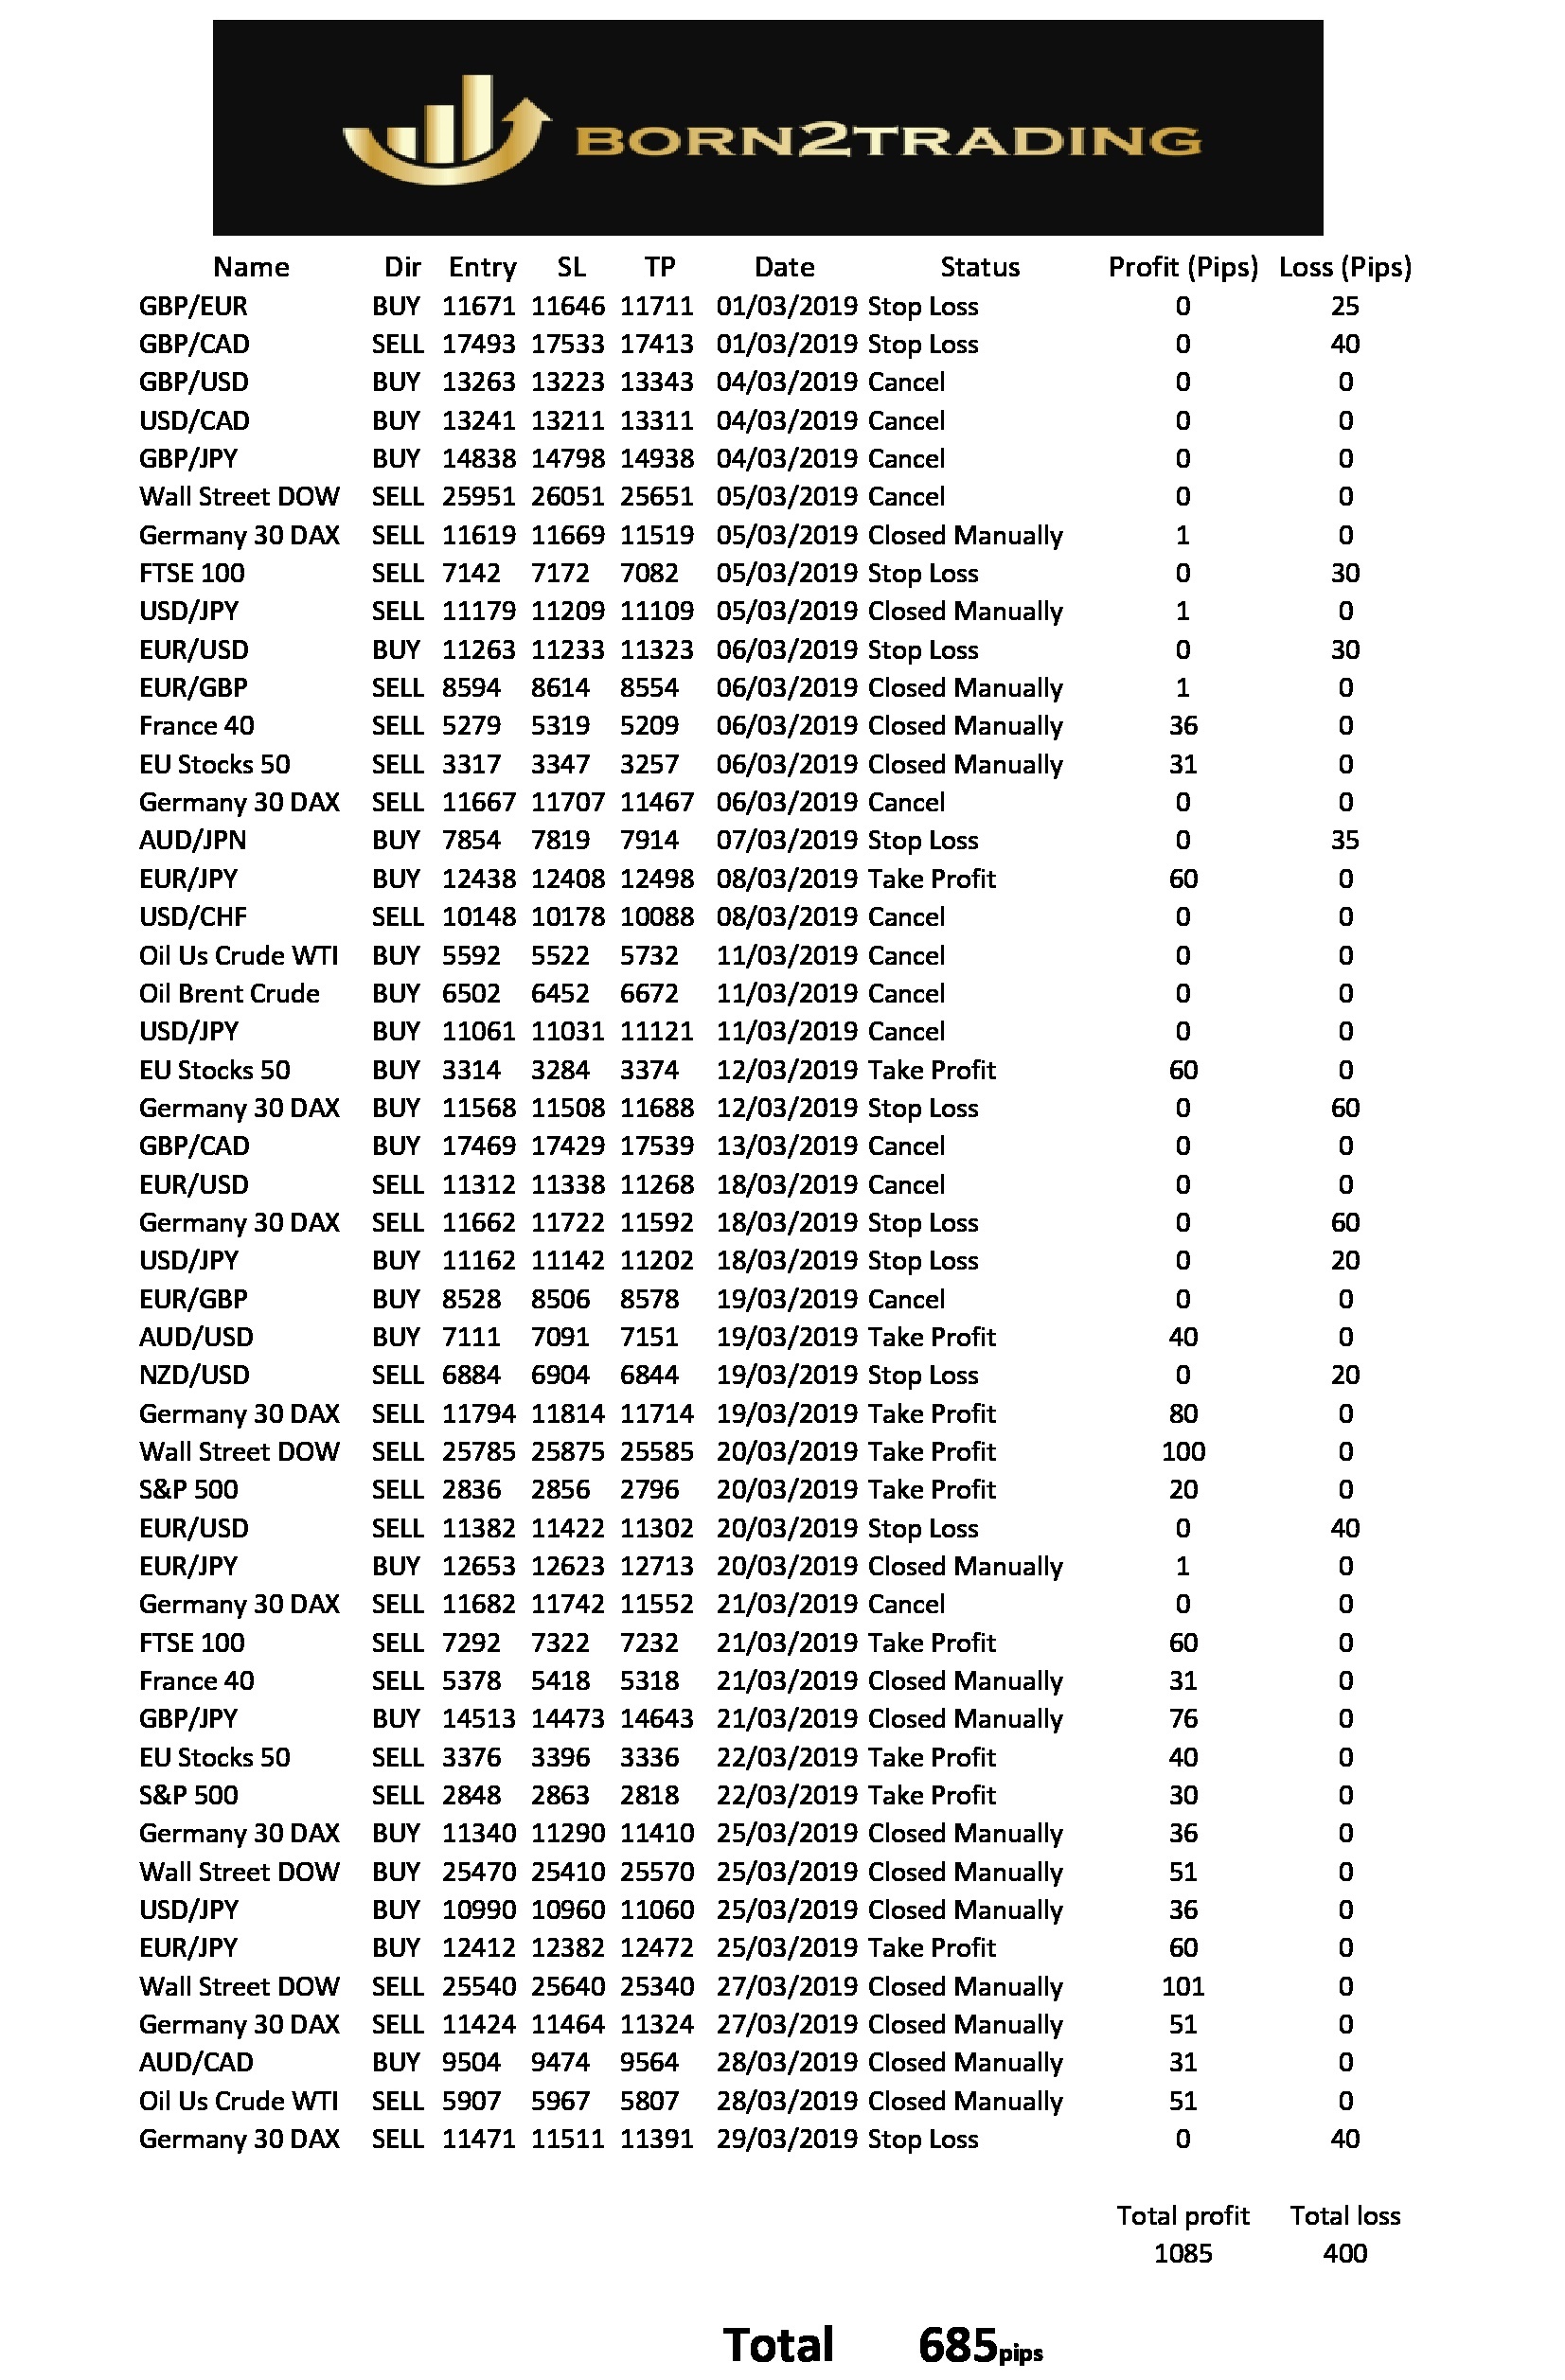
Trading Alerts stats - March 2019
This is our trading report for March 2019 , based on our trading alerts service.
We thank all our clients for their trust and cooperation so far.
Our success depands on your sucess!.
born2trading
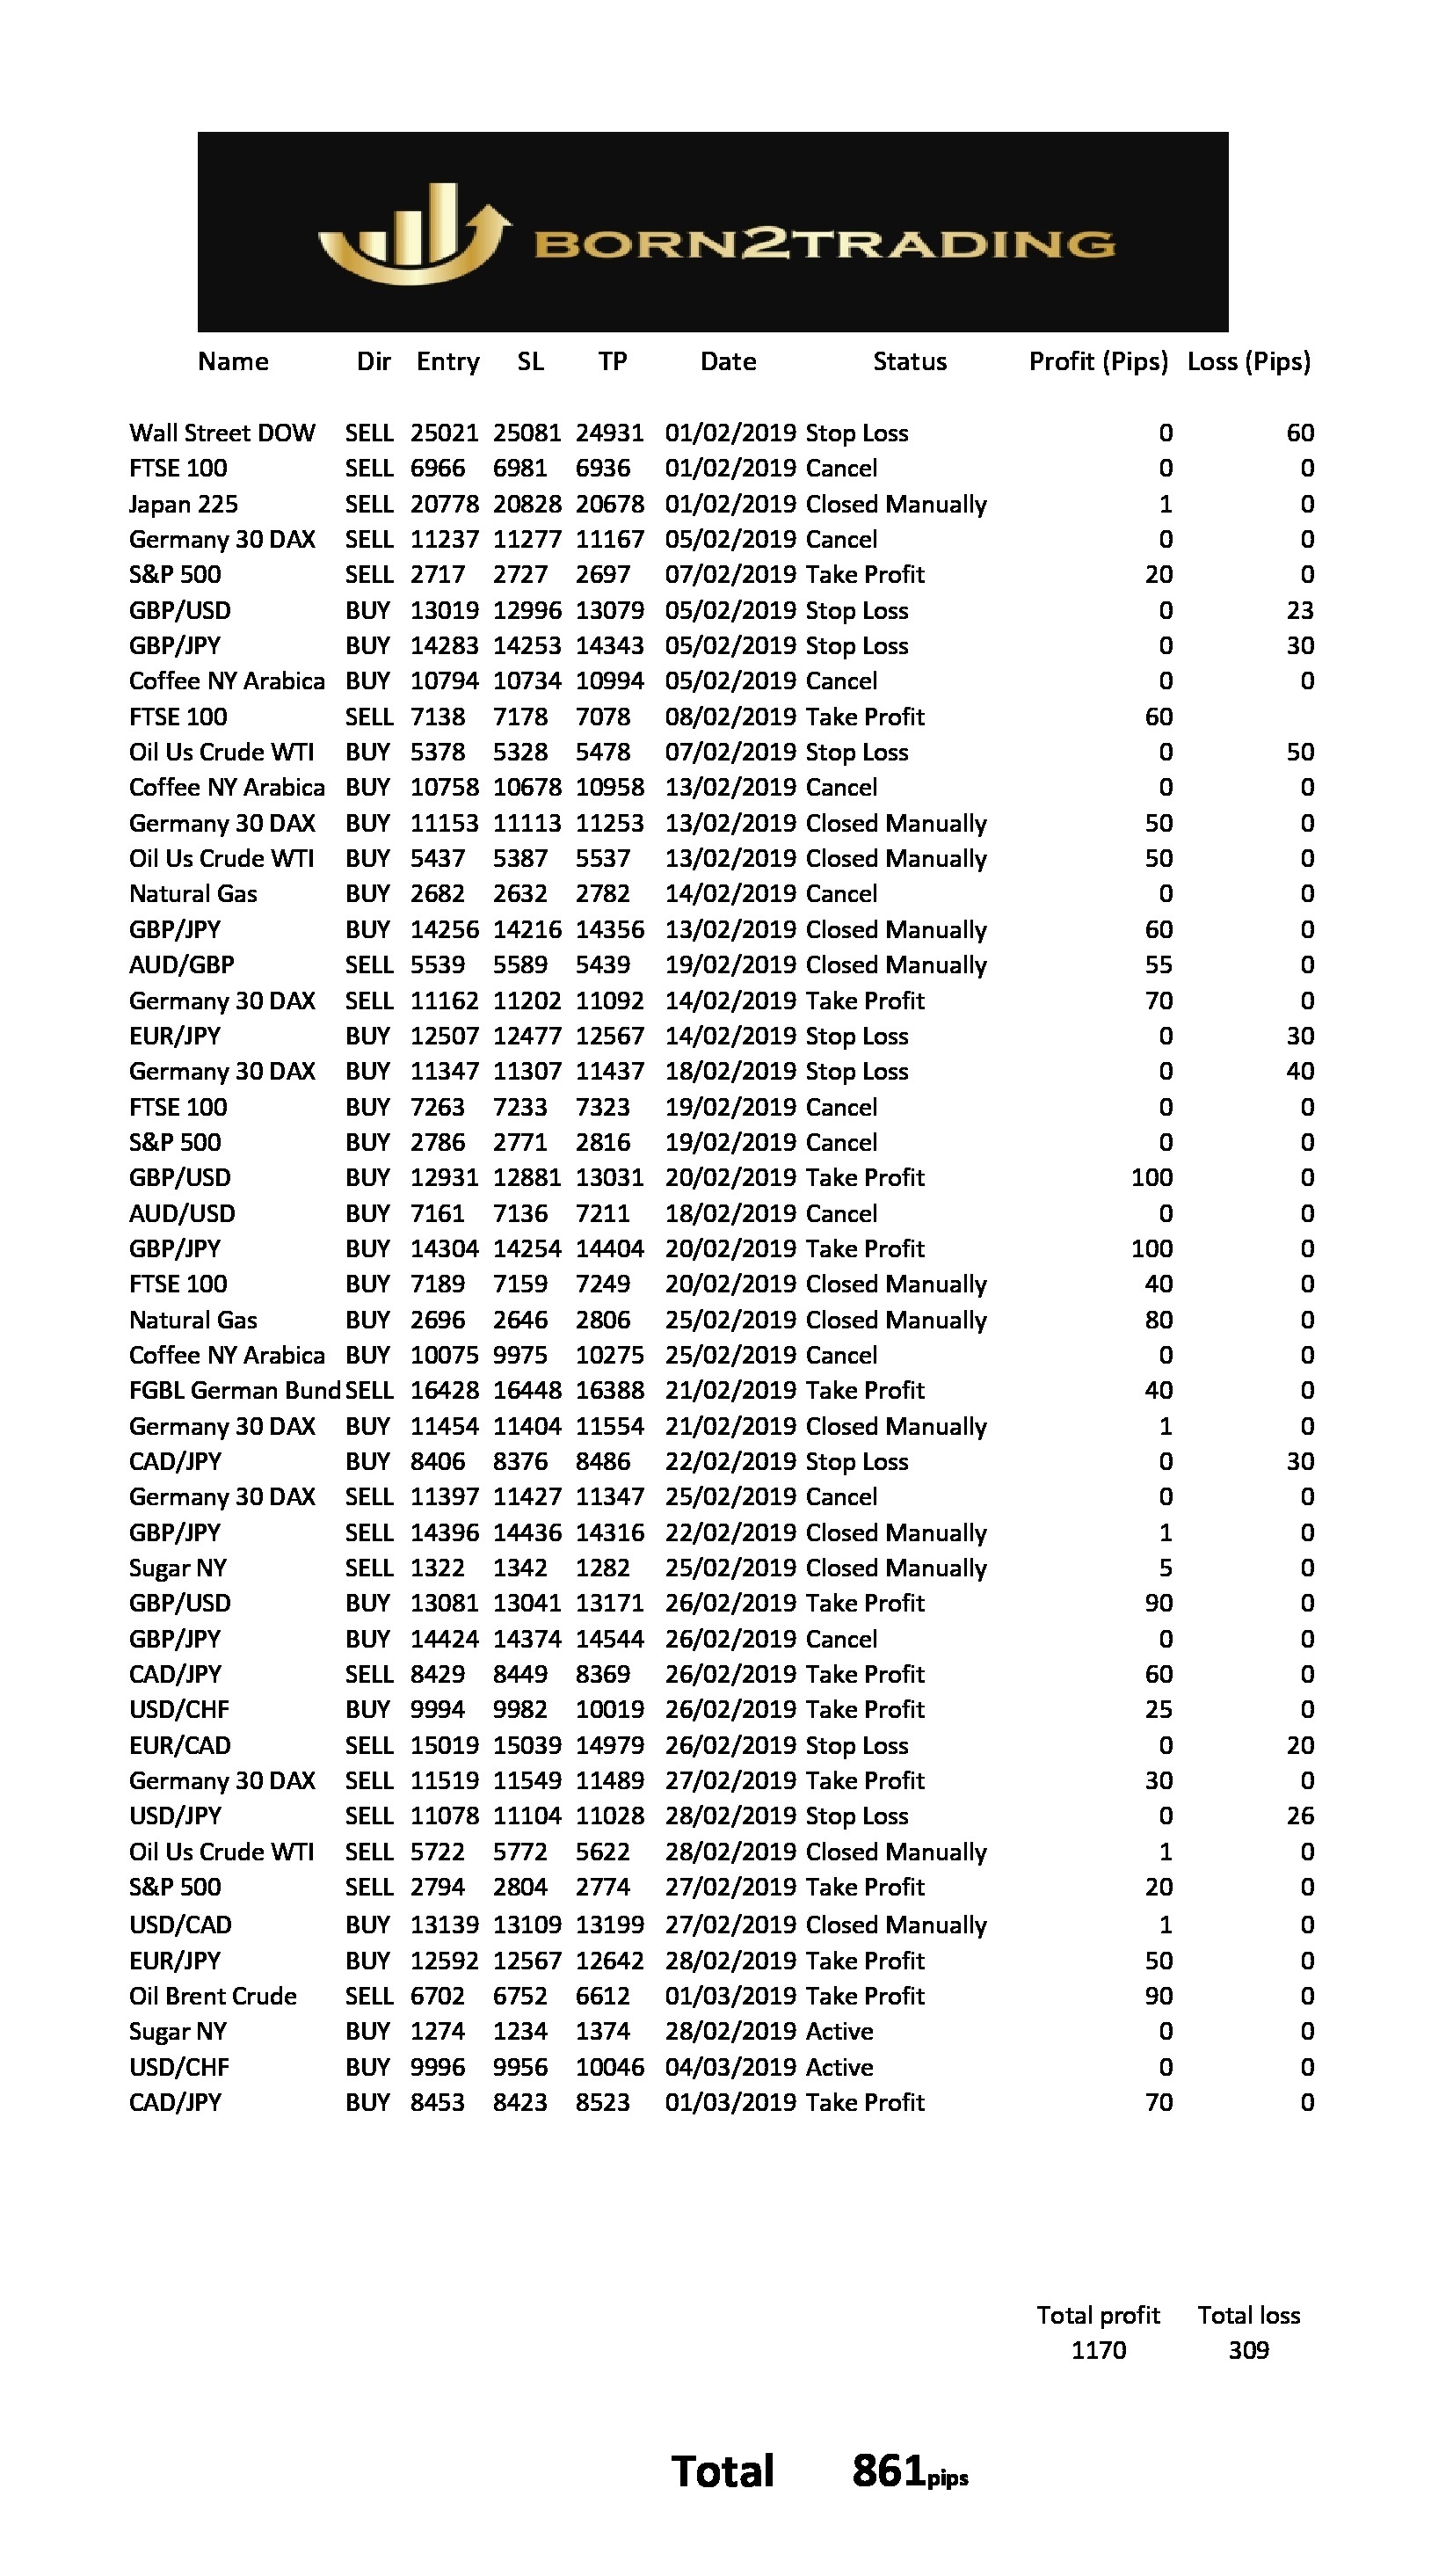
Trading Alerts stats - February 2019
This is our trading report for February 2019, based on our trading alerts service.
We thank all our clients for their trust and cooperation so far.
Our success depends on your success!
Team
born2trading.co.uk
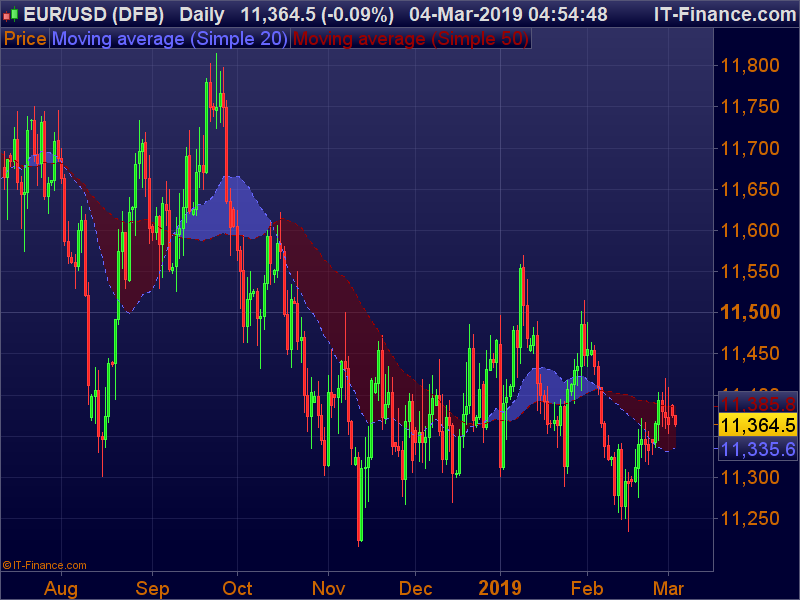
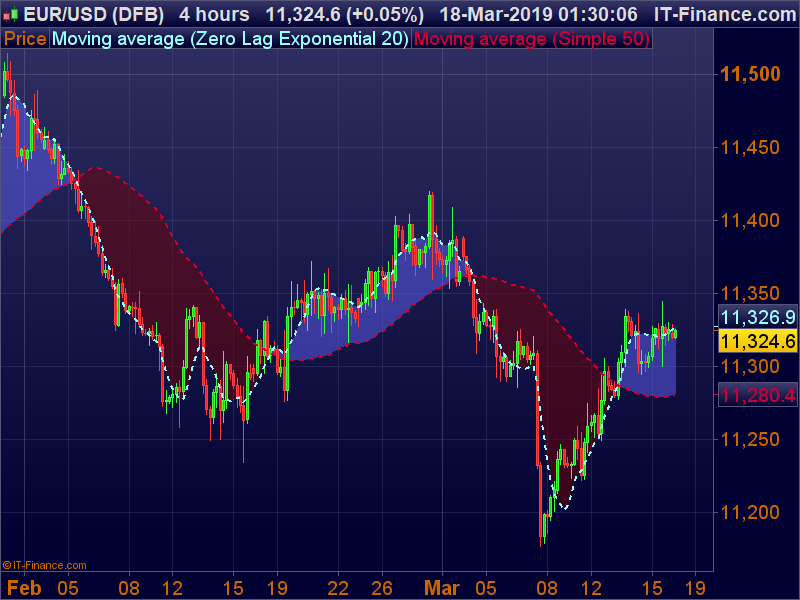
EUR/USD
Thursday sees EUR/USD in the center as we see GDP output figures from the eurozone amid the morning pursued by the most recent loan cost choice and proclamation discharged from the European National bank in the early evening. The absence of desires for the ECB to alter its current money related approach has kept the Euro-bound close to 18-month lows against the greenback. Introductory and proceeding with jobless claims information from the US is sandwiched between the two critical declarations from Europe
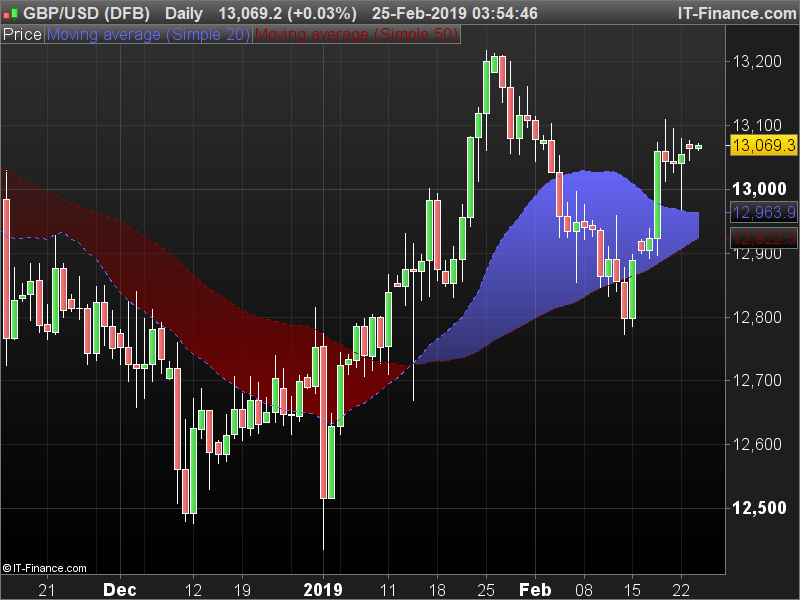
GBP/USD
The star entertainer a week ago was GBP versus USD, as the possibility of deferral to Brexit helped give the pound a lift over the ongoing 1.33 opposition level and addition from February lows of nearly 5%. This had a thump on impact onto the UK's mark value record that is comprised of overwhelmingly dollar-procuring organizations, causing a decrease in the UK100. US markets kept up their positive energy as the Fed Seat Jerome Powell affirmed before Congress expressing that the Central bank was in no hurry to make a judgment with respect to additional changes to financing costs or flow money related strategy. This combined with positive thinking encompassing the exchange talks between the US and China supported values to inside 5% ever highs. It's a given that refreshes between the world's biggest two economies will keep on powering instability one week from now, as will continuous Brexit dealings.
EUR/USD
The most commonly traded currency pair will be in focus once again on Thursday. German Consumer Price Index inflation data could be critical to the ECB making any amendments to their current stance on monetary policy. The lack of expectations for the ECB to amend its current monetary policy has kept the euro pinned down near 18-month lows against the greenback. A strong set of inflationary numbers for the largest European economy may support the EUR. Any gains or losses could be short-lived as we see employment data and Gross Domestic Product figures from the US in the afternoon.

Limiting Beliefs: What Have They Cost You and How Can You Destroy Them?
How often have you endeavored to explore new territory or achieve one of your objectives be that as it may, for reasons unknown, you talked yourself out of it? Consider a particular time when that occurred and recall what was happening in your mind right then and there. What sort of language would you say you were utilizing? Is it true that it was something positive or negative? I'm willing to wager it was a negative remark or reference your subliminal raised. It could have been an idea like, "No doubt right… you'll never have the capacity to do this," or memory of when you fizzled. This is the thing that we call a constraining conviction. Now and then our own self-talk in our mind attacks us before we even know whether we can accomplish something or not. Along these lines, we accomplish something pitifully or don't attempt by any stretch of the imagination. Constraining convictions are at the core of the reasons for what reason you're not achieving what you need in your exchange. It doesn't make a difference in what number of more devices, exchanging procedures, or masters you search out. Until you take out your restricting convictions, your outcomes will, in any case, be poor or you won't most likely get to that next dimension in your exchange.
When you stroll around with restricting convictions it resembles having a weighted vest on you consistently. The additionally constraining convictions you have, the heavier the vest and the more they overload
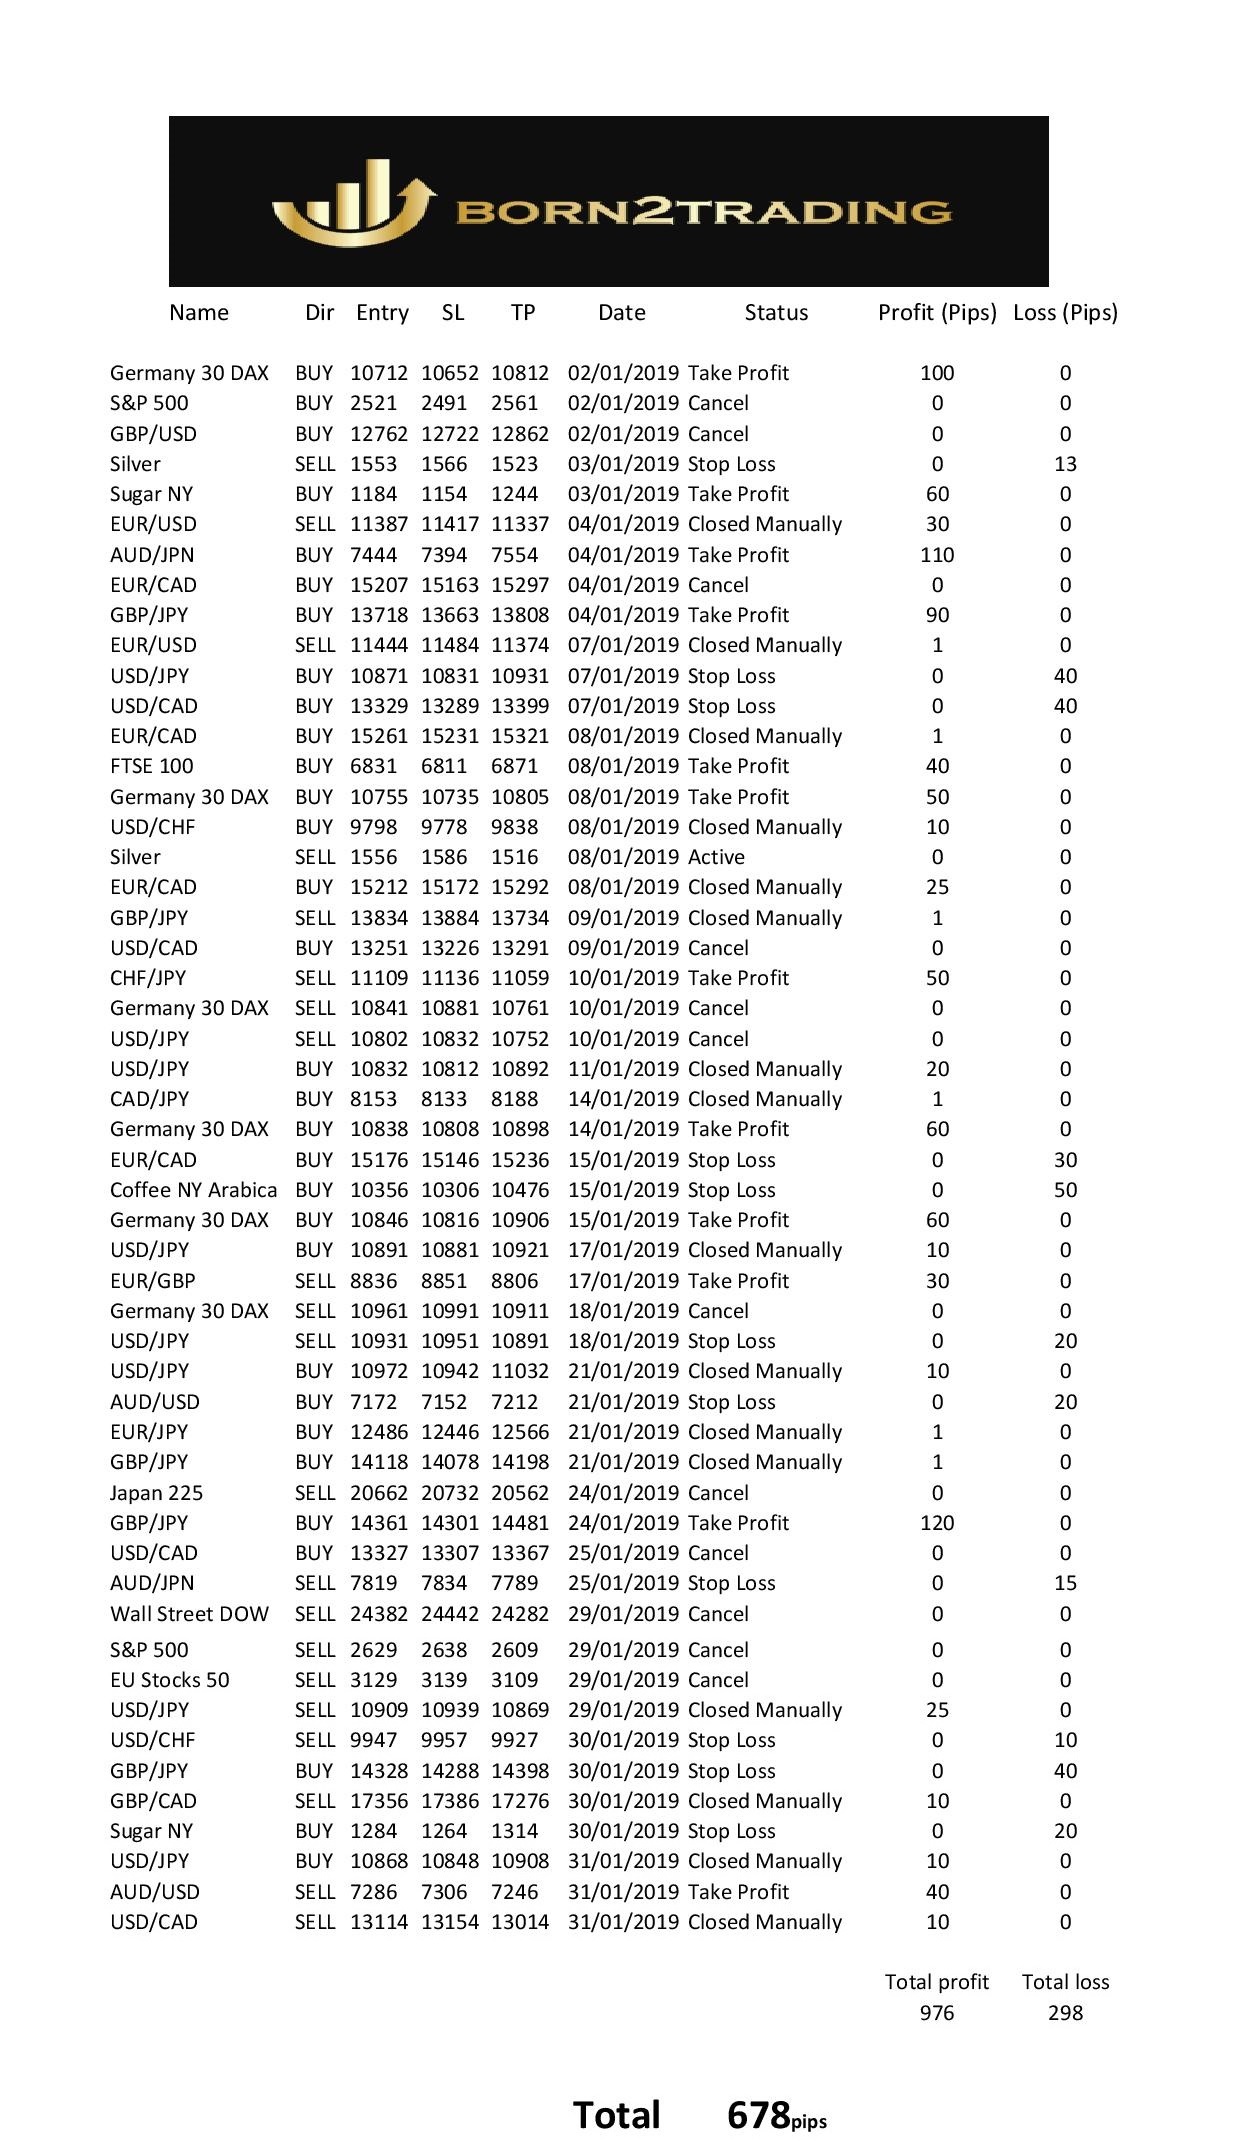
Trading Alerts stats - January 2019
This is our trading report for January 2019, based on our trading alerts service. We thank all our clients for their trust and cooperation so far.
Our success depends on your success!
Team
born2trading.co.uk

Will central banks fuel a surge in Gold prices?
In the first quarter of 2018 demand for gold was up a whopping 42% year on year - according to the World Gold Council. It seems that most of the buying has come from central banks who - in 2010 - transitioned into being net sellers of gold to become net buyers of the yellow metal.
It is not yet clear why some central banks around the world have started to raise their gold reserves. One theory is that many emerging economies and fringe countries are trying to move away from the US dollar to end its status as the world's reserve currency.
After all, Russia and China have been very active in gathering support from global governments into creating a new gold-backed currency. With a frosty relationship developing between China and the US due to ongoing trade tariff disputes, many investors have diversified their portfolios to include gold - such as the world's biggest hedge fund manager Ray Dalio founder of the investment firm Bridgewater Associates and 69th richest person in the world with net worth of $15.2 billion according to Forbes.
A 70% Stock Market Crash?
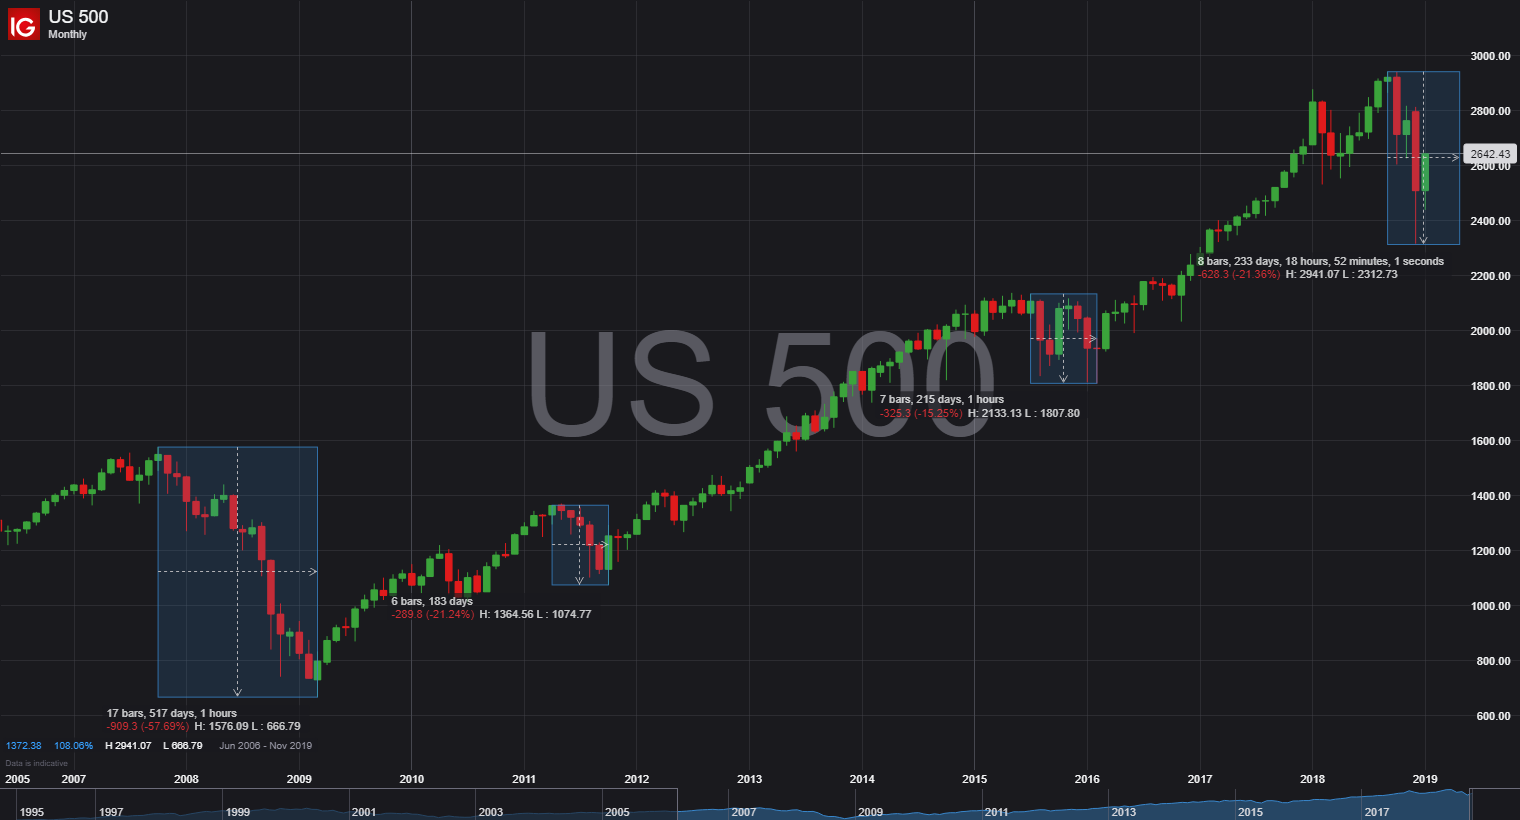
2018 has been one of the most volatile years global stock markets have seen since the 2008 financial recession. This volatility, combined with rising interest rates, may prove to be an explosive combination and is just one reason many hedge fund managers are predicting a stock market crash in 2019.
In some cases, there have been predictions of a 40% - 70% crash in the stock market:
- Scott Minerd, Chairman of Investments and Global Chief Investment Officer of Guggenheim Partners, has forecasted a 40% drop.
- The CIA's Financial Threat and Asymmetric Warfare Advisor Jim Rickards has claimed that a 70% drop is the best case scenario.
At the last Federal Reserve meeting of the year on 19 December, Chairman Jerome Powell reiterated his bullish stance on hiking interest rate in the future. With interest rate hikes preceding more than 10 economic recessions in the past 40 years, it is little wonder that stock market investors are predicting the worst for 2019. The technical chart also has some investors concerned.
Trading alerts stats - first two weeks of 2019
This is our trading report for the first two weeks of 2019, based on our trading alerts service. We thank all our clients for their trust and cooperation so far.
Our success depends on your success!
Team
born2trading.co.uk

GBP/USD what next?
GBPUSD could be the focal point on the final trading day of the next week. In the face of a potential global economic slowdown, gross domestic product numbers from the UK at 09:30 (the world’s 5th largest economy) could provide volatility ahead of US Consumer Price Index data out in the afternoon. Inflation is key for the pace at which the Federal Reserve will be hiking rates in 2019. Generally speaking, a high reading could be seen as positive (or bullish) for the USD, while a low reading could be seen as negative (or bearish).
From a technical point of view, we will be looking for a long position above 12820, alternative scenario sell position below 12680
EUR/CAD market preview
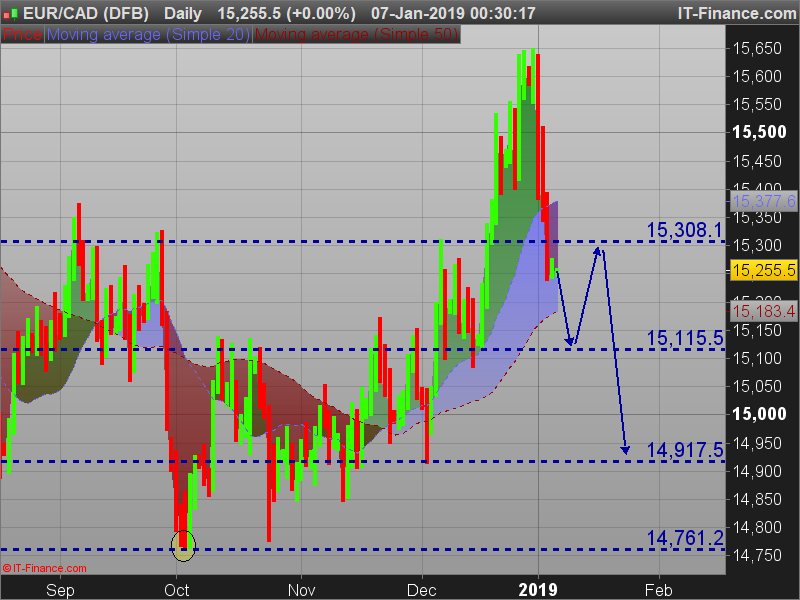
EURCAD seems to be the pair with the highest impact data out midweek. On Wednesday morning, the Euro could be affected by German import/export data and trade balance at 07:00 GMT, closely followed by Eurozone unemployment rate figures at 10:00 GMT. As afternoon trading gets underway, we see the latest interest rate decision from the Bank of Canada at 15:00 GMT, accompanied by a rate statement.
For the next few days for intraday trades, we will be looking for sell position below 15230 with potential target around15130

Global Growth Concerns Spill Into 2019 ...
Equity markets had a mixed first week to the start of 2019, coming off their worst year in a decade, with weak data in Asia and Europe confirming fears of a global economic slowdown while the U.S. government shutdown drags on. China’s factory activity contracted for the first time in 19 months in December, hit by the Sino-U.S. trade war, with the weakness spilling over to other Asian economies. Adding to the concerns was Apple Inc., who took the rare step of cutting its quarterly sales forecast, with chief executive Tim Cook blaming slowing iPhone sales in China. Apple is set to report their Q1 earnings release later in the month.
Key data out of the world’s second largest economy continues to come next week in the form of Chinese Consumer Price Index (inflation figures) on Wednesday at 01:30. On Thursday we will then get the Producer Price Index and more importantly, Chinese Gross Domestic Product in the early hours at 02:00. With China normally a focal gauge of economic growth, these numbers could dictate investor sentiment and the next direction for global indices such as Wall Street, UK 100 and the Germany 30.
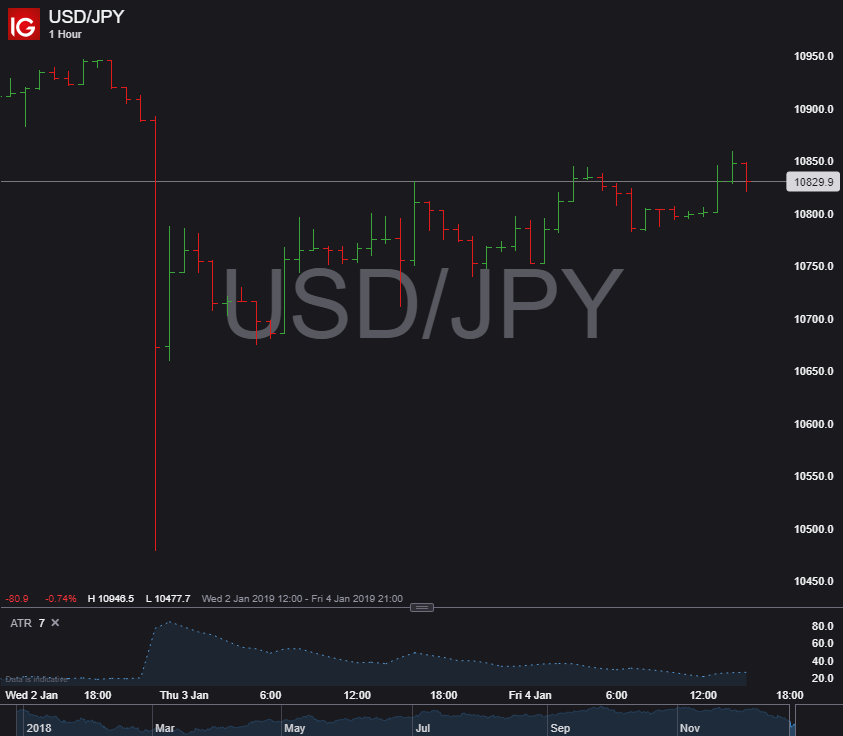
Flash Crash
Chinese economic data and significant uncertainty in the markets caused a massive, overnight flash-crash.
The yen was the safe harbor of choice and in a matter of 15 minutes many yen pairs tumbled nearly 600 pips.
Throughout the night and into the end of the U.S. trading day, most currency pairs recovered the majority of the difference seen in this dramatic move, returning to very close to an average close. Though a sell-off and recovery from a flash crash is not an indication of another crash, often half the distance of the range of the candle can be used as a target. We will be watching for more volatility and a mid-range target.

EUR/USD
The U.S. dollar dominated the forex market, gaining upwards of 1% against a number of currencies. U.S. equities traded lower during overnight, falling nearly 3% in some instances but equities were able to recover throughout the trading day ending relatively flat. Volatility has continued to slide and is at a two week low. The EUR/USD rolled over and fell more than 170 pips overnight. We missed the rollover but the price has confirmed horizontal resistance again. We will watch for a small bounce and a chance to sell the pair near 1.1400 on an intraday signal.

Donald Trump says: "Big progress being made!"
President Donald Trump said on Saturday he’d spoken at length with Chinese President Xi Jinping and that “big progress” is being made toward a deal between the world’s largest economies. The agreement will be “very comprehensive” and will cover “all subjects, areas and points of dispute,” the president, who’s spending the weekend in Washington, said in a tweet. Trump’s comment comes as a U.S. trade delegation prepares to travel to Beijing in early January for talks with Chinese officials. It’s another sign that tensions may be cooling after months of brinkmanship, and that the leaders are following through on commitments made at their dinner meeting in Buenos Aires on Dec. 1. Xi said both he and Trump hope to push for “stable progress” in U.S.-China relations, and that bilateral ties are now at a vital stage, according to a Xinhua News Agency report on the leaders’ phone call. Xi added that he and Trump discussed various international and regional issues, that China supports further talks between the U.S. and North Korea, and hopes for positive results, Xinhua reported. It was unclear who initiated Saturday’s call. The White House, which typically doesn’t release details of Trump’s calls with foreign leaders beyond what the president reveals himself, didn’t immediately respond to a request for comment. Bloomberg News reported on Thursday that a U.S. government delegation will travel to Beijing in the week of Jan. 7 for talks, according to two people familiar with the pl
The losses in December
The losses in December are predicted to be the greatest the US has seen since 1931 during the Great Depression, inciting fears of another recession. The last time such a fall was recorded was sixteen years ago when the S&P 500 saw a six percent fall during December 2002. This year, however, the S&P 500 has lost nearly eight percent of its value during this last month of 2018, eclipsing the earlier loss of 2002 by almost two percent.
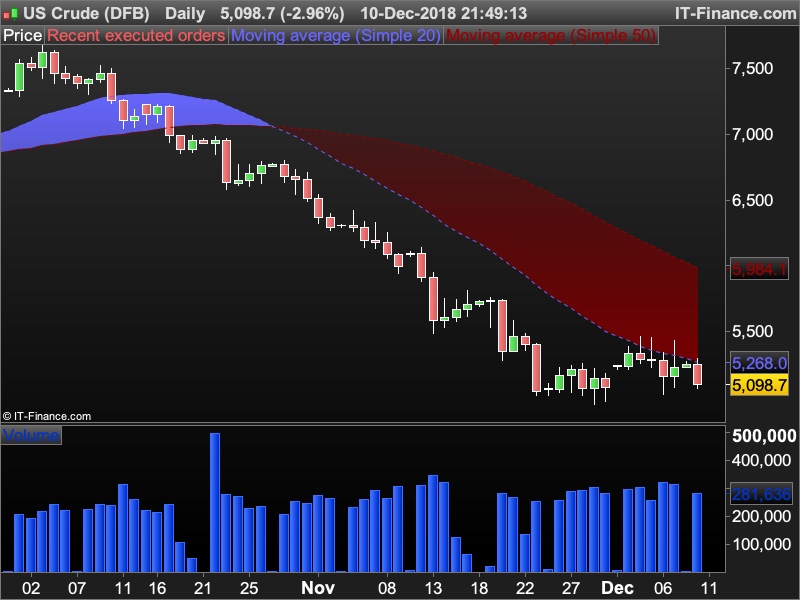
Light Crude Oil
The market for light crude oil futures continued to consolidate at and just above the all-important $50 level, as investors weighed global over-supply concerns against efforts from oil producers to potentially curb output. Going into this week, we notice the market opening essentially in the middle of the current short-term consolidation phase, potentially signalling the continuation of the current sideways trading theme. The lack of major bullish activity off the $50 level possibly hints at more buildup towards the downside going into the end of the current calendar year, but a lot, of course, depends on the ability of the $50 level to provide (or not provide) support to the market.

Brexit or not?
Cable is suffering heavy losses today -213 pts (-1.68%) and trading at fresh 18-month lows after British Prime Minister Theresa May abruptly pulled a parliamentary vote on her Brexit deal on Monday, throwing Britain’s plan to leave the European Union into chaos, after admitting that she faced a rout. May’s move on the eve of a crucial parliamentary vote opens up an array of options for the United Kingdom, including a disorderly Brexit with no deal, another referendum on EU membership, or the last minute renegotiation of May’s deal. Meanwhile, FTSE 250 share index fell 1.5%, hitting its lowest since December 2016. The steep falls reflect mounting uncertainty about the terms of the UK's exit from the European Union, analysts said."Until the market knows what will happen with respect to Brexit one way or the other then they [traders] will remain extremely anxious," said Jane Foley, head of foreign exchange strategy at Rabobank. Ms Foley said the threat of a hard Brexit, under which the UK leaves the EU without a deal, as well as the continuing political uncertainty, was "an extraordinary and toxic mix" for the pound. "Once we know what is happening, things will be more settled," she added.
Light Cude Oil
As expected, the market for light crude oil did stall at the critical $50 mark, as bears take a step back to evaluate their achievement thus far. Much of the mid-to-longer term prospects for the market still hinge on OPEC’s upcoming meeting on December 6 relating to global output decisions, but the rapid drop in price down to the critical $50 level has had the sellers thinking once again. On the chart, this was printed as a stall precisely at the $50 level, and an open this week well above the $50 price level suggests we could be in for a potential pullback into the steep move down that the market witnessed for much of November. Notably though, while we notice the market stalling at the $50 level, we do not yet see any major bullish signs or price action that would suggest a complete reversal or even a major retracement into the downtrend just yet. We believe that as of now, the bears still appear to be the dominant of the two parties.
BRENT CRUDE
Oil slipped to trade near 2018 lows due to pressure from rising U.S. inventories and doubts over whether an OPEC-led output cut will be agreed in the coming week. The price of Brent Crude has slumped by more than 30% from a 4 year high in early October, as concerns that supply will exceed demand in 2019 as economic growth slows. EIA Crude Oil Stocks Change will be important data to watch on Wednesday at 15:30 to see if the downturn will continue.
AUD/CAD
The AUD has seen a strong recovery in the final quarter of 2018 against CAD. In the early hours of Tuesday morning, we get the latest announcement on the interest rates from the Reserve Bank of Australia accompanied by a statement from the Reserve Bank board about forward guidance. Overnight they also release Gross Domestic Product figures which evaluates the total value of all goods and services produced. At 15:00 on Wednesday we get an interest rate decision and statement from the Bank of Canada (BoC). If the BoC is hawkish and leans towards a rise in the interest rate it could be viewed as positive, or bullish, for the CAD. Likewise, if they have a dovish view, this could be seen as negative, or bearish.
EUR/USD
On the last trading day of the week, EURUSD could be the main focus. GDP data from the Euro Zone will be released at 10:00 followed shortly after by the final Nonfarm Payroll figures from the US at 13:30. Despite the comments from Fed chair Jerome Powell last week suggesting they may be nearing an end to its three-year rate tightening cycle, the greenback kept the Euro pinned near 2018 lows as eyes move towards the employment data from the world’s largest economy. Could a strong number cement the Feds plan to raise rates multiple times next year, or will weaker employment figures reduce the expectations on the number of hikes in 2019 providing the EUR with a chance of recovery?
Gold
The bullish momentum from the impact has sent price closer to the $1240 level which, if tested early this week, could pose an interesting scenario and a potential bullish breakout environment. For now, the market seems obviously sideways and choppy which we suspect will remain the theme going into this week unless we see a confident break past the $1240 level or a sharp break under the $1200 mark.
Light Crude Oil
However, the news plus the technical catalyst in the form of the $55 price level were not enough to push the market out of a month and a half long selloff that appears to be goin

US midterm 2018
Half elections, referred to as "midterms", take place in the middle term of the President of the United States. During the vote, the new members of the House of Representatives are elected (435 people) and about 1/3 of the Senate is exchanged (this year, voting applies to 35 out of 100 seats). The combined forces of the House of Representatives and the Senate make up the United States Congress.
At the moment, these two chambers are under the control of the Republican Party. This arrangement for the past two years has greatly facilitated the efforts of Donald Trump, who is the Republican leader. The current US president had greater freedom of action, thanks to which he introduced tax cuts for businesses, which made corporations start to withdraw their cash to foreign countries.
Will the situation change after today's election? Probably yes. Above all, Democrats have a very good chance to take over the House of Representatives. According to polls, the chance
